Fig. 4
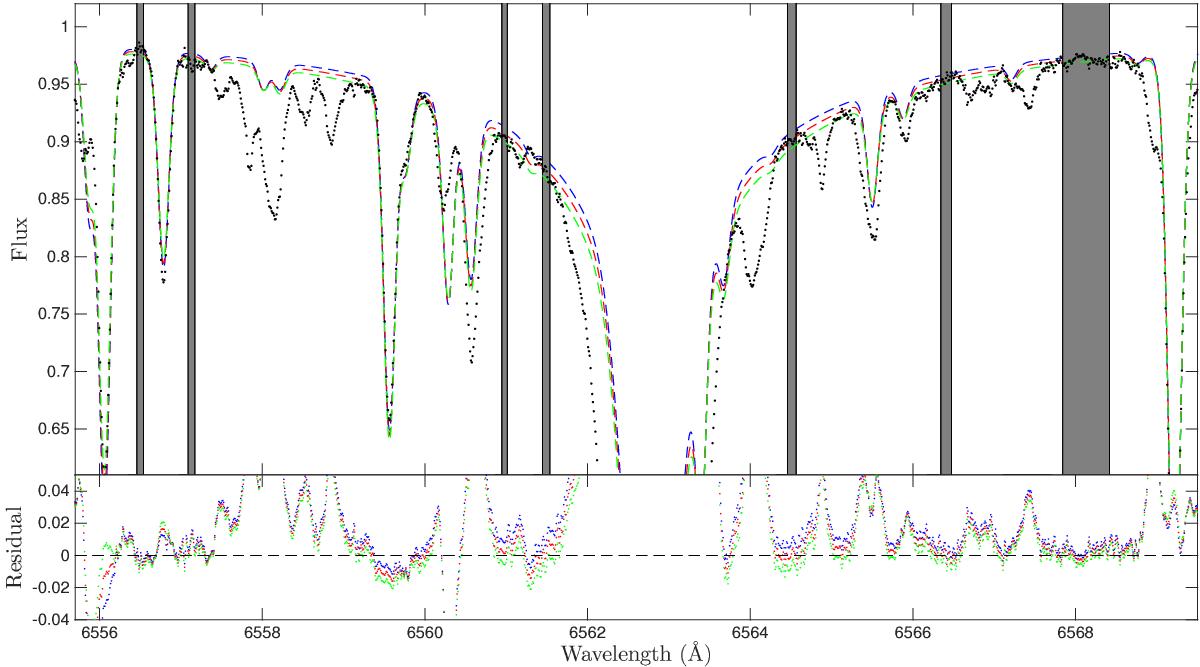
Comparison of synthetic spectra with the wings of Hα line in ϵVir. The middle synthetic spectrum (in red) shows the best fit. The other two synthetic spectra (blue and green) indicate the shape of the wings when Teff is changed according to our estimated uncertainty (here 50 K). The grey areas mark the regions used to evaluate the goodness of the fit. Note that these are relatively narrow since the spectrum has very little clean “line continuum” thanks to the cool temperature of the star, which results in many lines being present in the spectrum.
Current usage metrics show cumulative count of Article Views (full-text article views including HTML views, PDF and ePub downloads, according to the available data) and Abstracts Views on Vision4Press platform.
Data correspond to usage on the plateform after 2015. The current usage metrics is available 48-96 hours after online publication and is updated daily on week days.
Initial download of the metrics may take a while.