Fig. 3
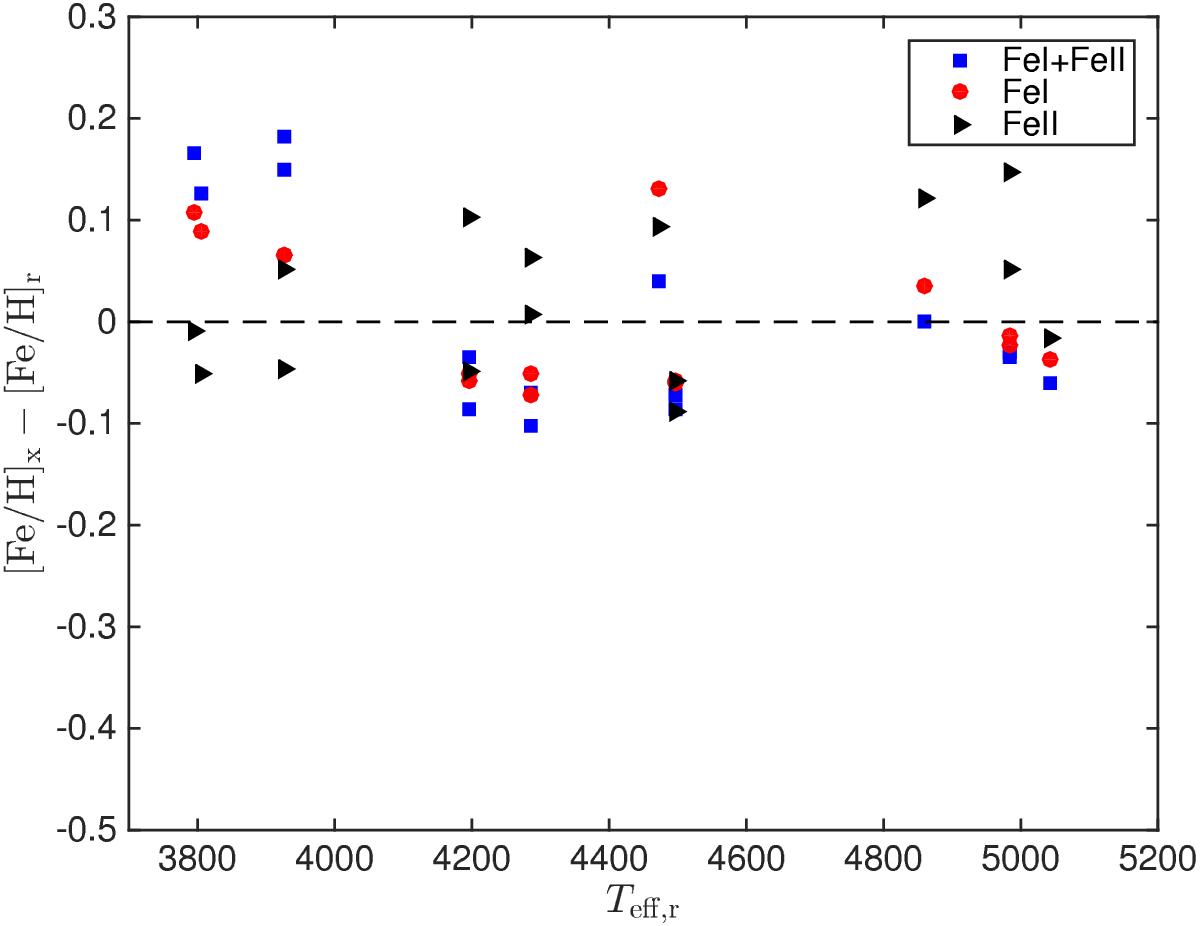
Test of the ability of our linelist to reproduce the reference [Fe/H] for the Gaia benchmark stars. The y-axis shows the difference between the reference value and the value we derive (using the reference Teff and log g, but our own linelist and SME). We derived [Fe/H] in three ways: using both Fe i and Fe ii lines (blue filled squares), using only Fe i lines (red filled circles), and using only Fe ii lines (black filled triangles). The stars can be identified using the Teff values which are given on the x-axis. For some of the stars we have more than one spectrum. Results for both are shown in the plot.
Current usage metrics show cumulative count of Article Views (full-text article views including HTML views, PDF and ePub downloads, according to the available data) and Abstracts Views on Vision4Press platform.
Data correspond to usage on the plateform after 2015. The current usage metrics is available 48-96 hours after online publication and is updated daily on week days.
Initial download of the metrics may take a while.