Fig. E.1
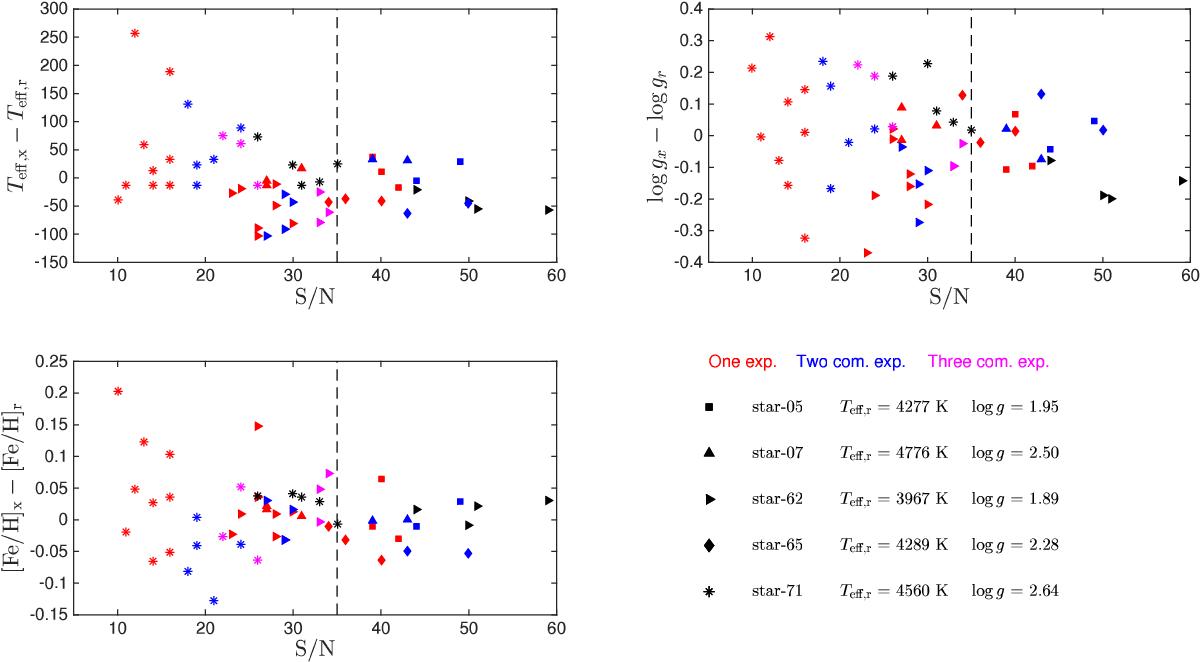
Comparison of the derived stellar parameters as a function of S/N. The y-axes show the difference between the value for each parameter derived from the low S/N spectrum and the value derived from the final combined spectrum (i.e. that used in the analysis in Sect. 6. The stellar parameters of the five stars are given in the legend. The colours (indicated in the legend) refer to how many spectra have been combined to obtain the analysed spectrum.
Current usage metrics show cumulative count of Article Views (full-text article views including HTML views, PDF and ePub downloads, according to the available data) and Abstracts Views on Vision4Press platform.
Data correspond to usage on the plateform after 2015. The current usage metrics is available 48-96 hours after online publication and is updated daily on week days.
Initial download of the metrics may take a while.