Fig. 1
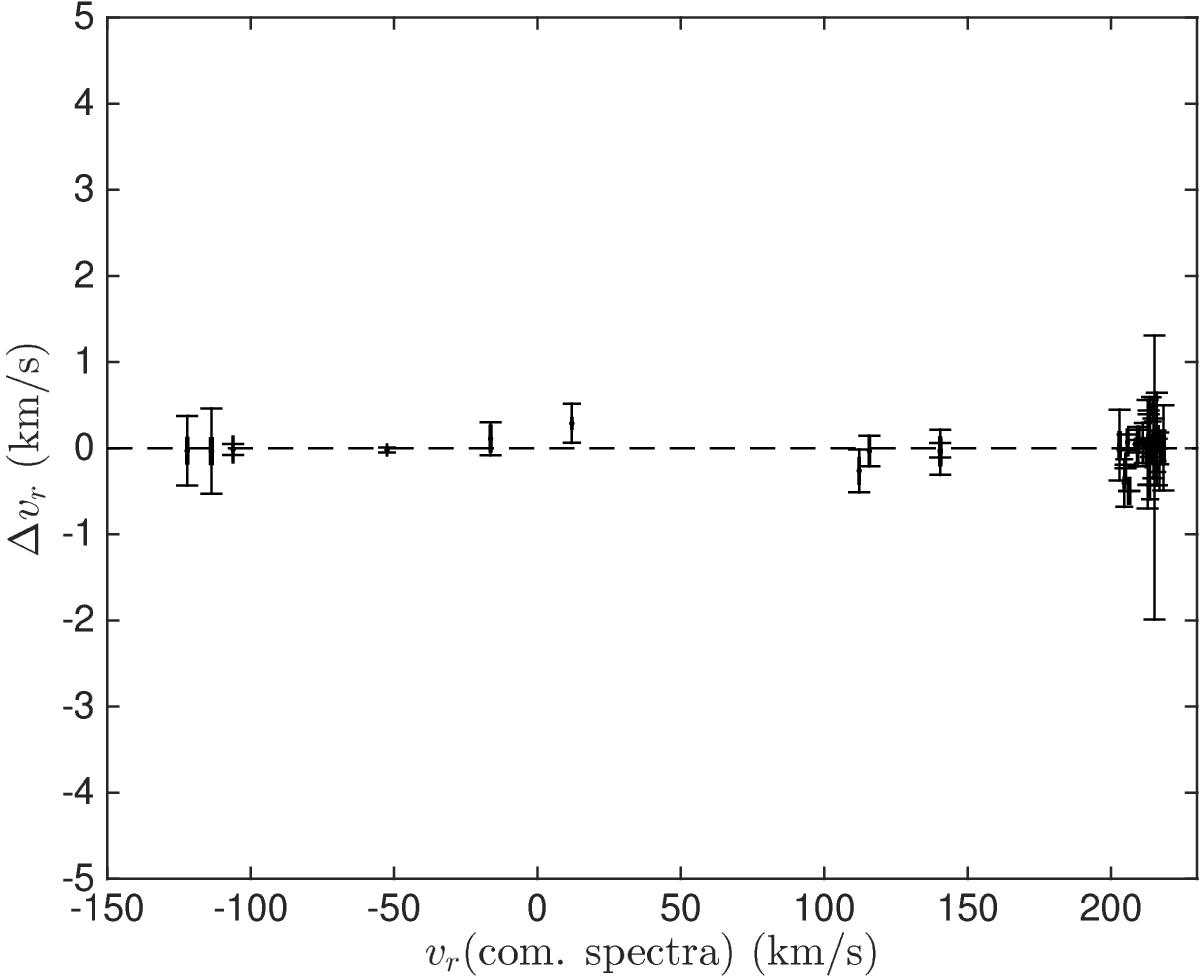
Comparison of radial velocities for the stars derived from the combined spectrum and from the individual spectra separately and then averaged (see Sect. 2.2.3). The x-axis shows the value derived from the combined spectra whilst the y-axis shows the difference between vr determined in the two ways. The error-bars for the difference is the coadded errors estimated from IRAF (for the combined spectra) and the σ around the mean for the independent measures. Errors on the x-axis are too small to be seen.
Current usage metrics show cumulative count of Article Views (full-text article views including HTML views, PDF and ePub downloads, according to the available data) and Abstracts Views on Vision4Press platform.
Data correspond to usage on the plateform after 2015. The current usage metrics is available 48-96 hours after online publication and is updated daily on week days.
Initial download of the metrics may take a while.