Free Access
Fig. 4
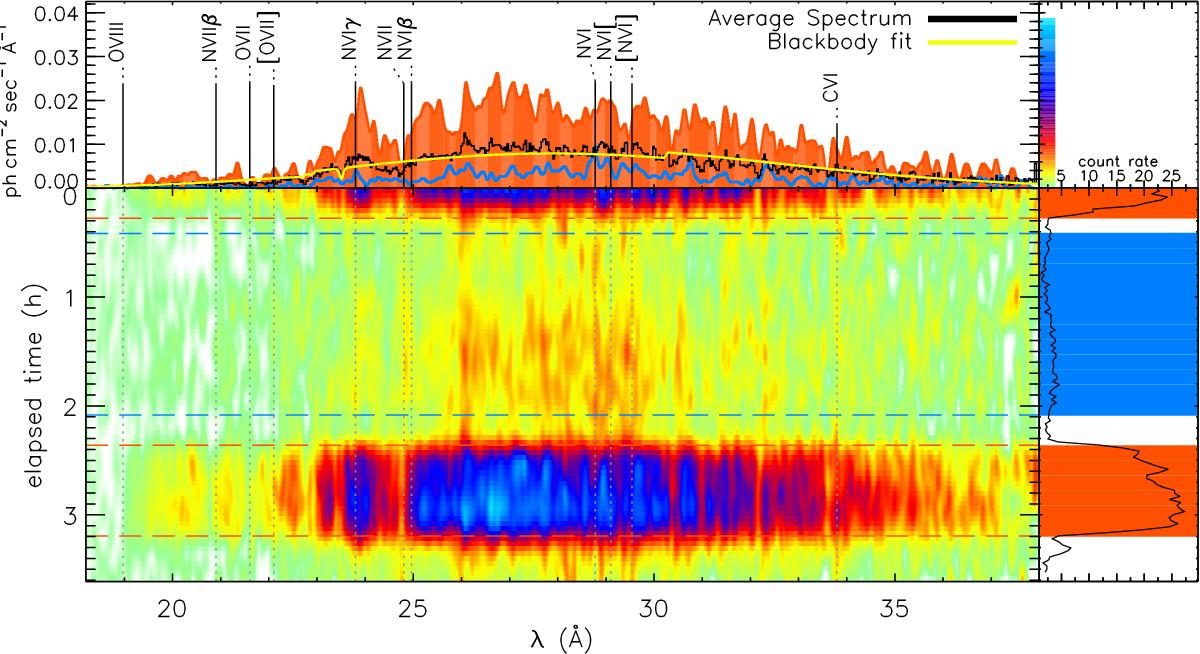
XMM-Newton RGS time map. Evolution of the emission features during the XMM-Newton observation in March 2007. Colors in the central panel correspond to photon fluxes, with the color key given in top right box, along the Y-axis spectrum.
Current usage metrics show cumulative count of Article Views (full-text article views including HTML views, PDF and ePub downloads, according to the available data) and Abstracts Views on Vision4Press platform.
Data correspond to usage on the plateform after 2015. The current usage metrics is available 48-96 hours after online publication and is updated daily on week days.
Initial download of the metrics may take a while.