Fig. 8
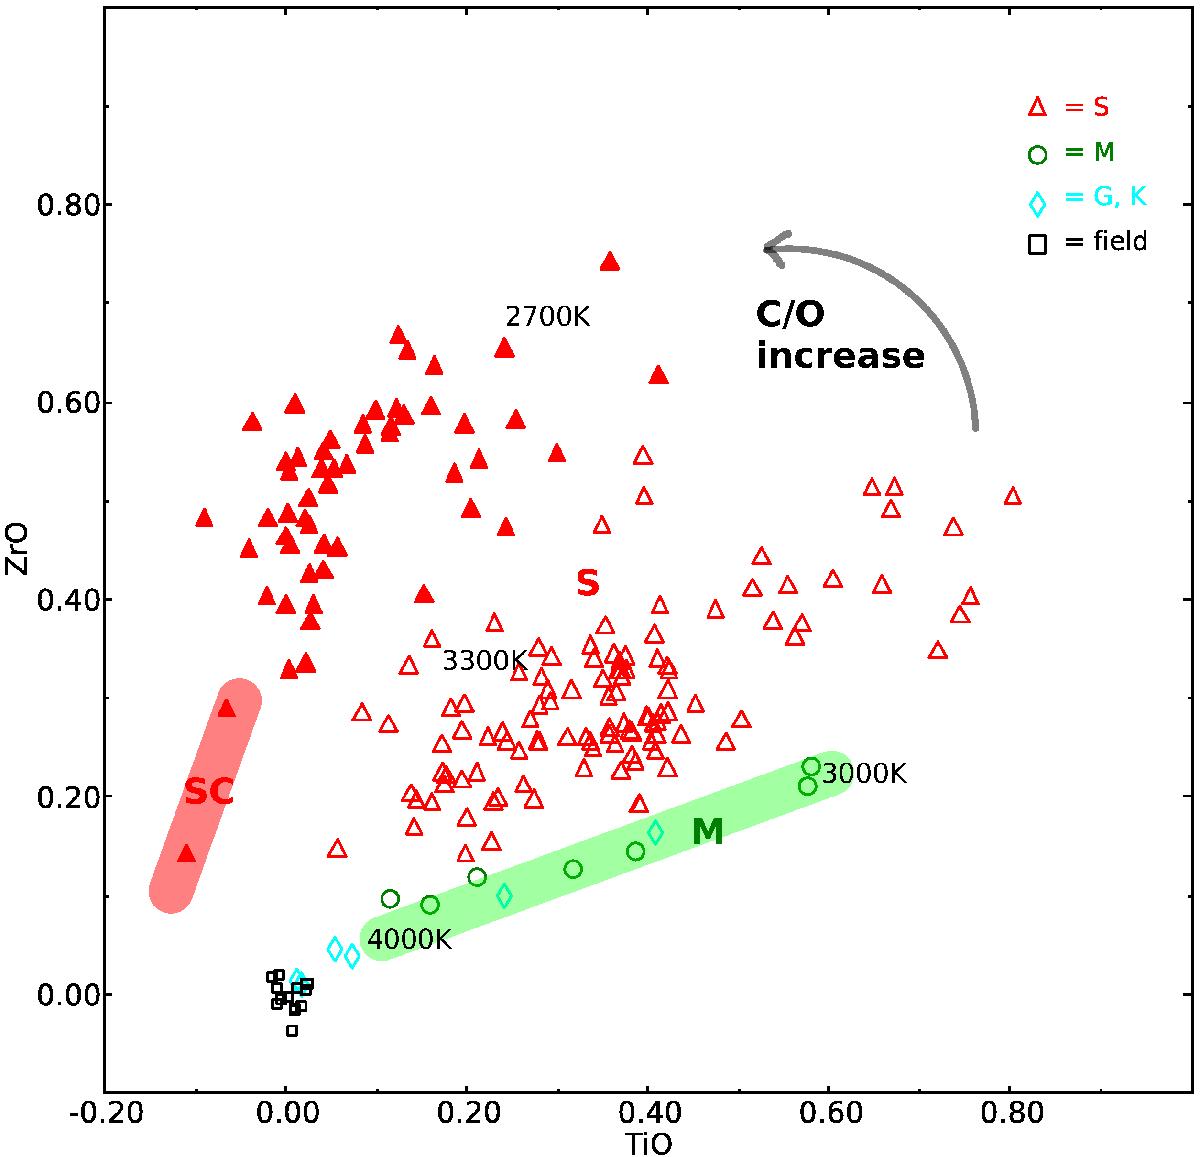
Same as Fig. 6; stars displaying noticeable LaO bands are plotted as filled triangles. Most of them are pure S stars or SC stars. The location of M (C/O ~0.5), S (0.5< C/O <1) and SC stars (C/O ~1) is indicated, as well as some typical effective temperatures. The arrow is an approximative indication of the loop described in this diagram by the stars as they evolve on the TPAGB, as explained in Sect. 3.4.
Current usage metrics show cumulative count of Article Views (full-text article views including HTML views, PDF and ePub downloads, according to the available data) and Abstracts Views on Vision4Press platform.
Data correspond to usage on the plateform after 2015. The current usage metrics is available 48-96 hours after online publication and is updated daily on week days.
Initial download of the metrics may take a while.