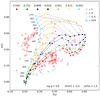
Fig. 6
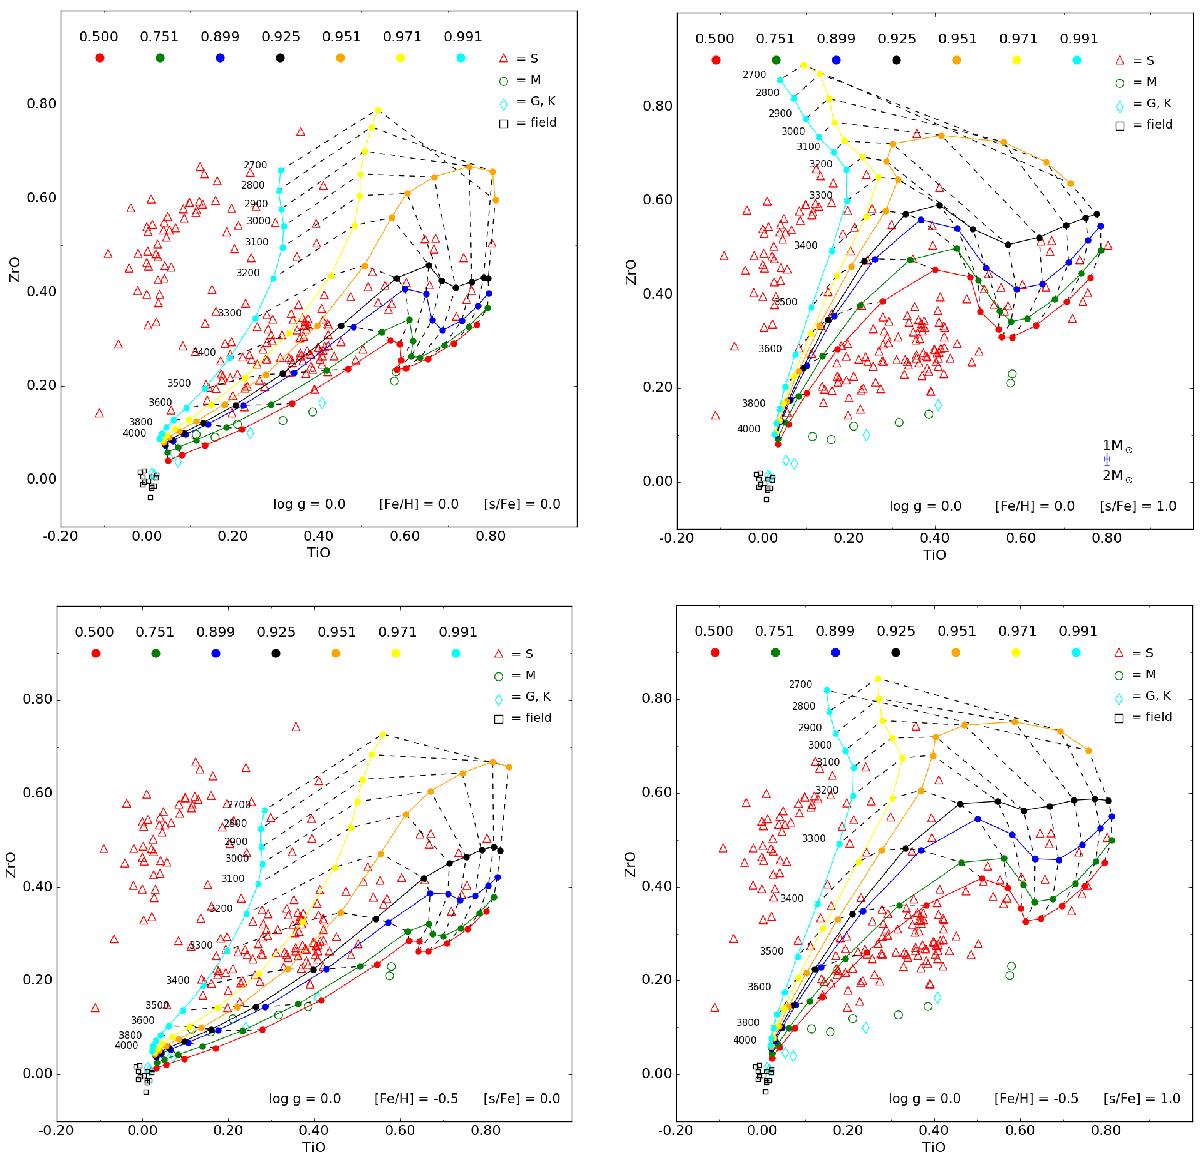
Measured BTiO and BZrO band indices from observed spectra of different stellar types (as labelled) compared to band indices computed from synthetic spectra for the same grid of temperatures (models with identical – as indicated – effective temperatures joined by dashed black lines) and C/O ratios (connected by solid coloured lines, for the same values as those displayed in Fig. 5, the largest C/O value corresponding to the most vertical solid line). The four panels correspond to various combinations of metallicity and [s/Fe] ratio, as labelled. Field stars (radial velocity standards and flux calibrators without molecular bands) are clumping around (BTiO, BZrO) = (0, 0), as expected. The small error bars on the lower right corner of the [Fe/H] = 0, [s/Fe] = 1 panel represent the largest variations (computed at 3000 K, 3400 K and 3800 K) of the indices of 2 M⊙ models with respect to 1 M⊙ models, 1 M⊙ models having slightly stronger lines (and larger indices) than 2 M⊙ models.
Current usage metrics show cumulative count of Article Views (full-text article views including HTML views, PDF and ePub downloads, according to the available data) and Abstracts Views on Vision4Press platform.
Data correspond to usage on the plateform after 2015. The current usage metrics is available 48-96 hours after online publication and is updated daily on week days.
Initial download of the metrics may take a while.