Fig. 2
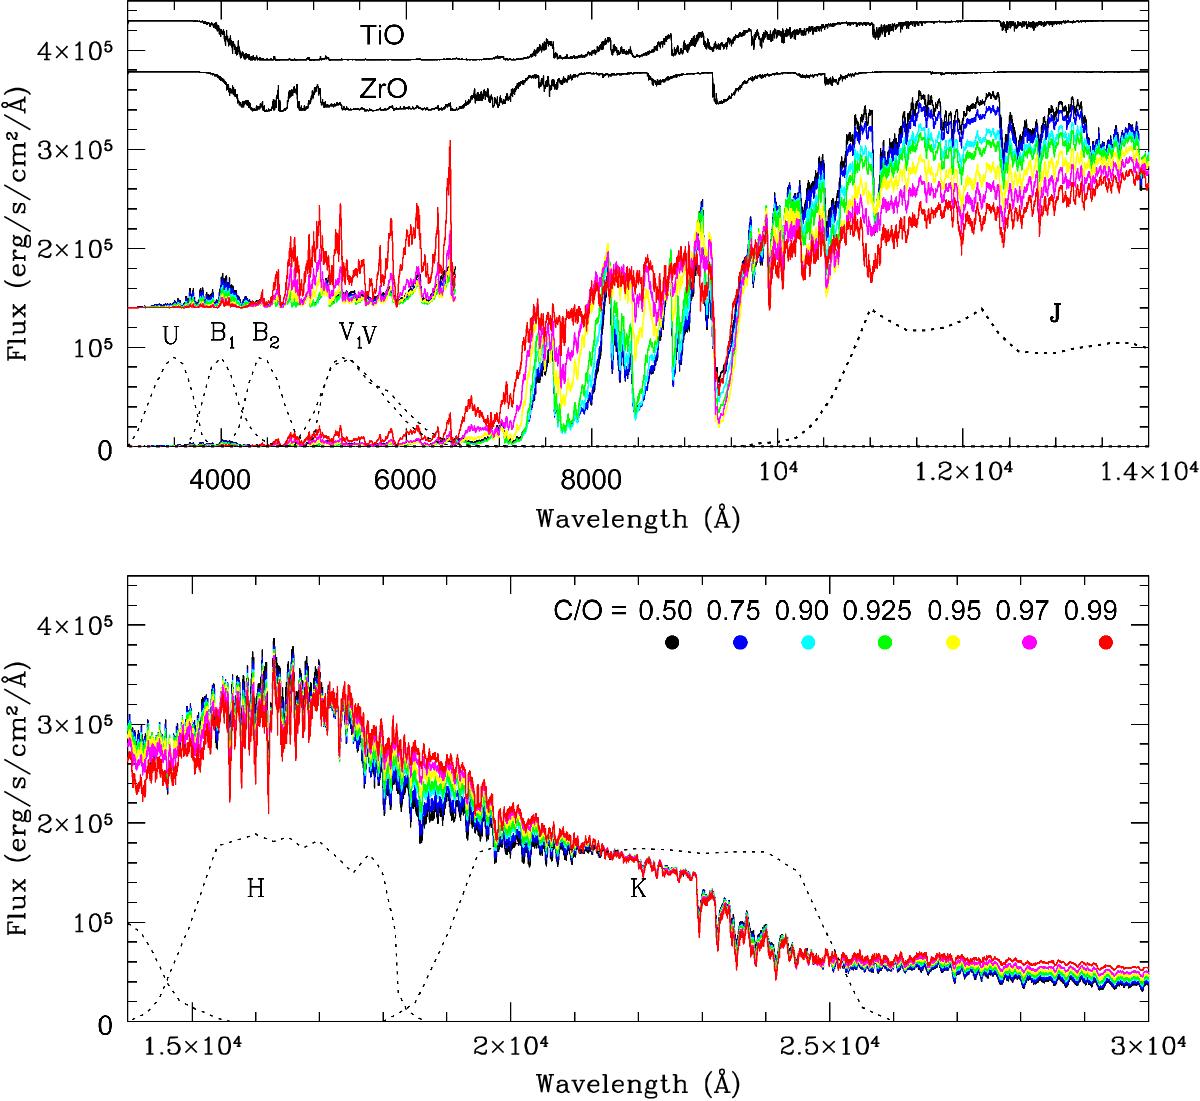
Influence of the C/O ratio on synthetic spectra obtained for the models corresponding to the thermal structures displayed in Fig. 1: Teff = 3000 K, [s/Fe] = 1 dex, log g = 0, M = 1 M⊙, [Fe/H] = 0, and C/O ratios as labelled. The U,B,V,V1,J,H,K bandpasses are plotted in black dashed lines, as well as, in black on the top panel, synthetic spectra of pure TiO and pure ZrO (for the same temperature and C/O = 0.5) to help identifying molecular-band contributors. For the sake of clarity, spectra are also zoomed shortward of 6500 Å.
Current usage metrics show cumulative count of Article Views (full-text article views including HTML views, PDF and ePub downloads, according to the available data) and Abstracts Views on Vision4Press platform.
Data correspond to usage on the plateform after 2015. The current usage metrics is available 48-96 hours after online publication and is updated daily on week days.
Initial download of the metrics may take a while.