Fig. 2
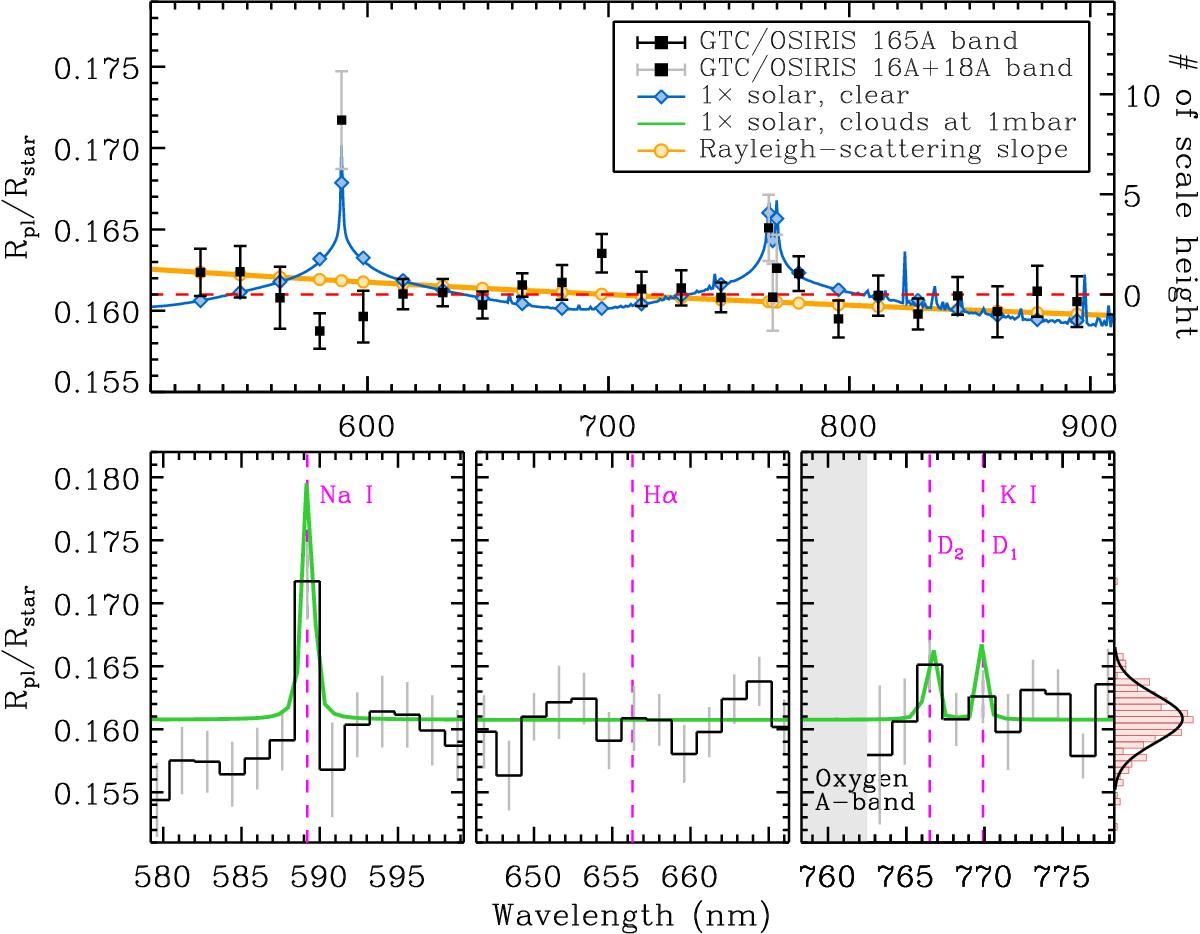
GTC/OSIRIS transmission spectrum of WASP-52b. Top panel: the transmission spectrum composed of 22 bins of 16.5 nm (black squares with black error bars), 3 bins of 16 Å centered on Na and K, and 1 bin of 18 Å in-between the K doublet (black squares with gray error bars). The blue line shows a 1300 K 1× solar cloud-free model (Kempton et al. 2017). The orange line shows a Rayleigh-scattering model (α = −4). The red dashed line shows a flat line at Rp/R⋆ = 0.1608. Bottom panels: the close-up of Na, Hα, and K lines (black histogram with gray error bars) in bins of 16 Å (or 18 Å). The green line shows a 2700 K 1× solar atmosphere with the clouds at 1 mbar. The red histogram on the right shows the distribution of all the 16 + 18 Å transit depths.
Current usage metrics show cumulative count of Article Views (full-text article views including HTML views, PDF and ePub downloads, according to the available data) and Abstracts Views on Vision4Press platform.
Data correspond to usage on the plateform after 2015. The current usage metrics is available 48-96 hours after online publication and is updated daily on week days.
Initial download of the metrics may take a while.