Fig. 1
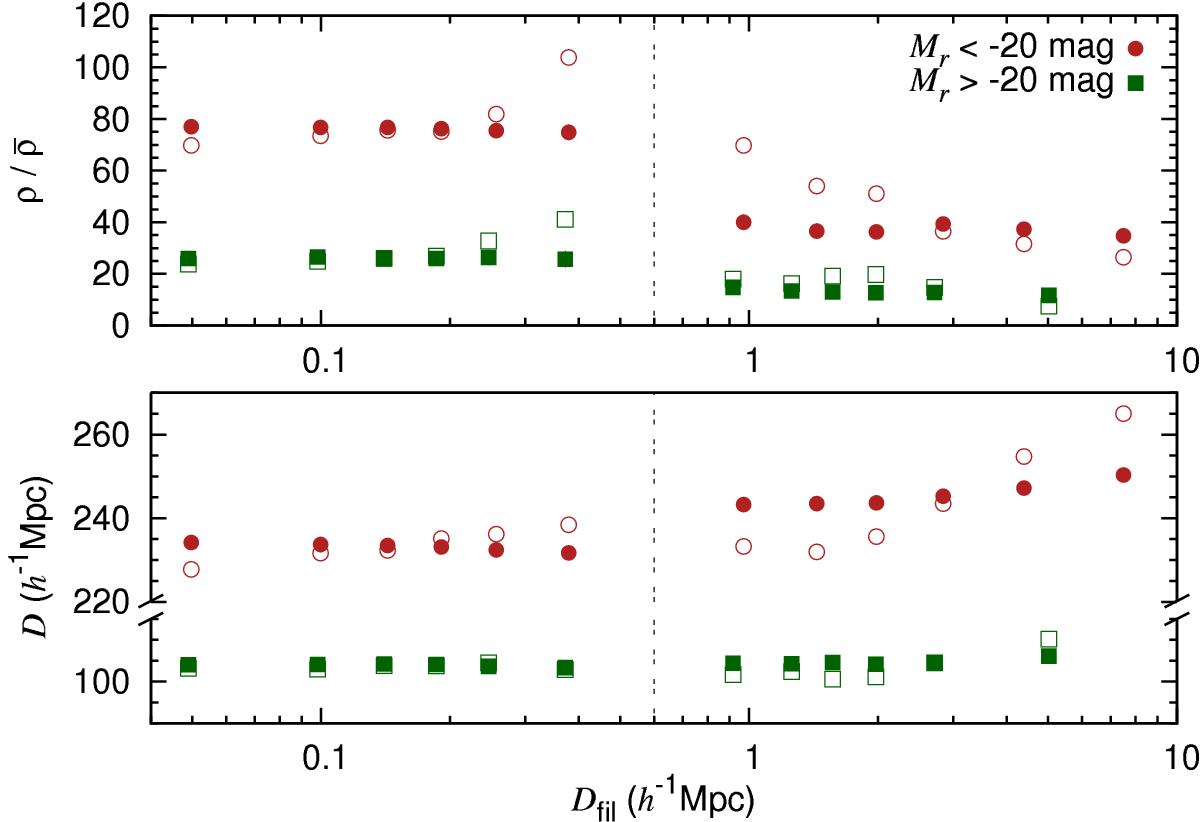
Mean environment density around the galaxies (upper panel) and the mean distance of galaxies (lower panel) as a function of distance from the nearest filament spine, Dfil. The empty (filled) symbols correspond to the values before (after) normalisation. Red circles represent the brighter volume-limited sample and green squares the fainter one. The 2σ variations derived from 1000 bootstrap sampling iterations are smaller than the points on the graph.
Current usage metrics show cumulative count of Article Views (full-text article views including HTML views, PDF and ePub downloads, according to the available data) and Abstracts Views on Vision4Press platform.
Data correspond to usage on the plateform after 2015. The current usage metrics is available 48-96 hours after online publication and is updated daily on week days.
Initial download of the metrics may take a while.