Fig. 2
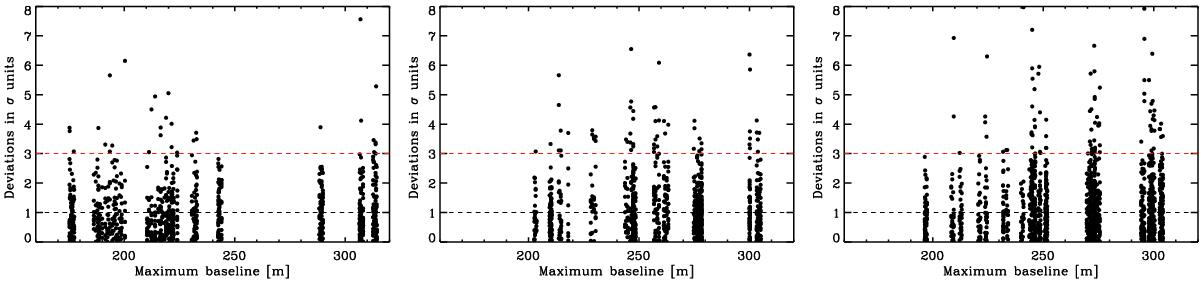
Closure phase departures from zero or ±180° for all the observed stars and for all the wavelengths. For every data point, the lowest value between |data-0°|, |data-180°| , and | data+180°| is computed and normalised by the corresponding observed error, σ. β Oph is shown in the left panel, ϵ Cyg in the central, and HR 7633 in the right panel. The horizontal black line corresponds to the value of 1σ and the red line to 3σ.
Current usage metrics show cumulative count of Article Views (full-text article views including HTML views, PDF and ePub downloads, according to the available data) and Abstracts Views on Vision4Press platform.
Data correspond to usage on the plateform after 2015. The current usage metrics is available 48-96 hours after online publication and is updated daily on week days.
Initial download of the metrics may take a while.