Fig. 3
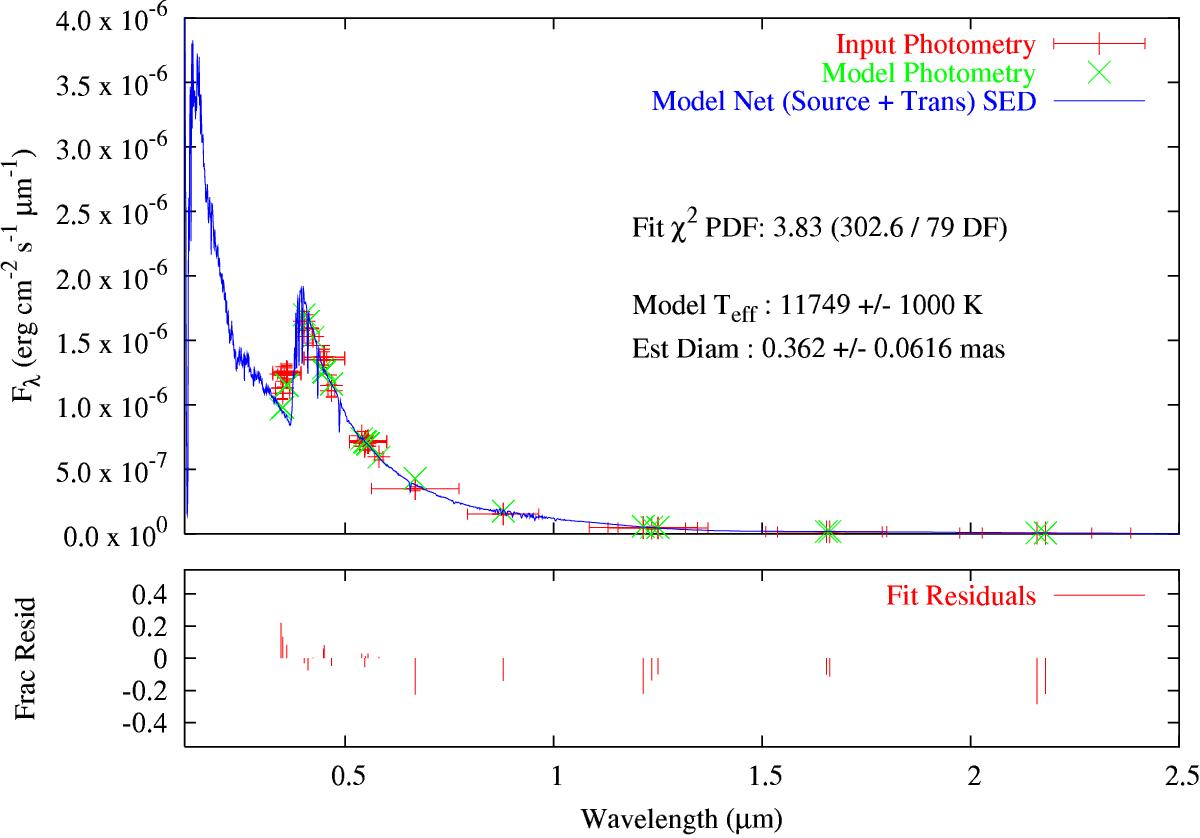
Fit of apparent diameter (and effective temperature) to Simbad photometry with sedFit. The red symbols correspond to the photometric data and the green crosses to the model values. The blue line denotes the template from Pickles (1998) for a B8 main-sequence star. The (reduced) χ2 of the fit is given in the figure as well. The lower panel shows the fit residuals as fractions of the total flux.
Current usage metrics show cumulative count of Article Views (full-text article views including HTML views, PDF and ePub downloads, according to the available data) and Abstracts Views on Vision4Press platform.
Data correspond to usage on the plateform after 2015. The current usage metrics is available 48-96 hours after online publication and is updated daily on week days.
Initial download of the metrics may take a while.