Fig. 6
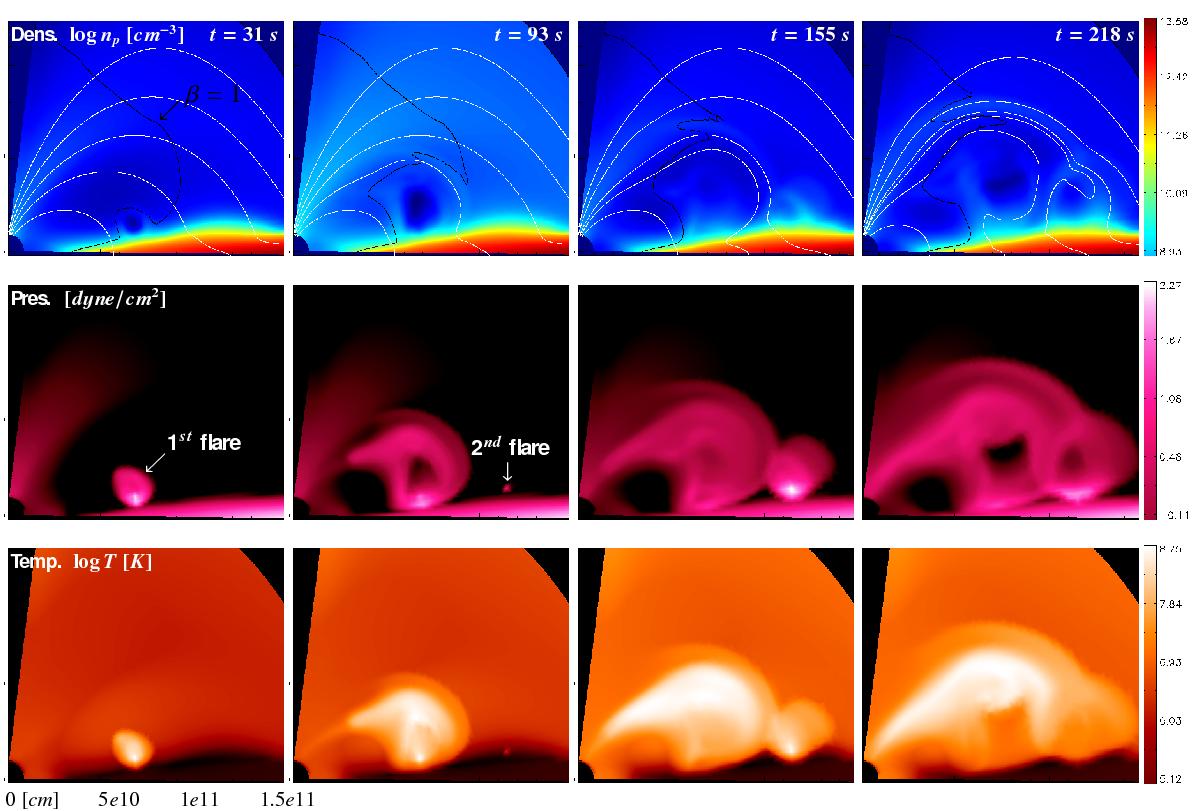
Two following flaring loops during their evolution. The figure shows the distribution of density (upper panels), pressure (middle panels), and temperature (lower panels) in a slice in the [ r,θ ] plane passing through the middle of the loops. In the upper panels white lines represent magnetic field lines projected in the [ r,θ ] plane, while the black line shows the β = 1 surface. The slice encompasses an angular sector going from the rotation axis to the disk equatorial plane. The first flare occurs in a β> 1 region, surrounded with β< 1 region, and produces a magnetically confined loop linking star and disk. The second flare is also released in a β> 1 region, but at a larger distance from the star and at approximately the same angle φ, compared with the first flare. It appears a bit later in time, at time t = 93 s, and becomes bright at t = 155 s. Differently from the first flare, the hot plasma of the second flare is not magnetically confined (run F4f1.00a).
Current usage metrics show cumulative count of Article Views (full-text article views including HTML views, PDF and ePub downloads, according to the available data) and Abstracts Views on Vision4Press platform.
Data correspond to usage on the plateform after 2015. The current usage metrics is available 48-96 hours after online publication and is updated daily on week days.
Initial download of the metrics may take a while.