Fig. 4
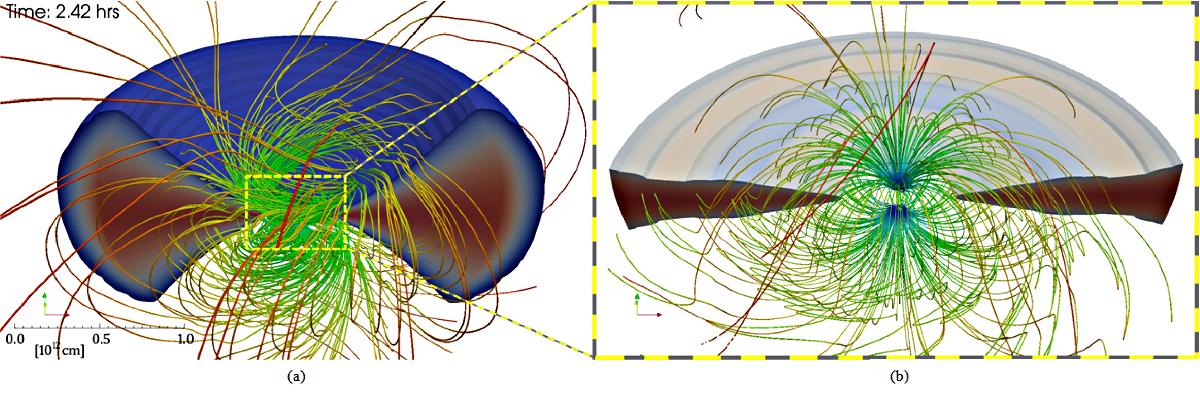
Result of the simulation performed to generate the initial configuration of the 3D simulation: a) cutaway view of the simulations after ~2.5 h with a fully developed magnetic field. The yellow box contains the region mapped in 3D and used as the initial condition of the 3D simulations; b) rendering of the initial condition of 3D simulations, the borders of the figure are the same as those of the yellow box in the left panel (run F3f1.00c).
Current usage metrics show cumulative count of Article Views (full-text article views including HTML views, PDF and ePub downloads, according to the available data) and Abstracts Views on Vision4Press platform.
Data correspond to usage on the plateform after 2015. The current usage metrics is available 48-96 hours after online publication and is updated daily on week days.
Initial download of the metrics may take a while.