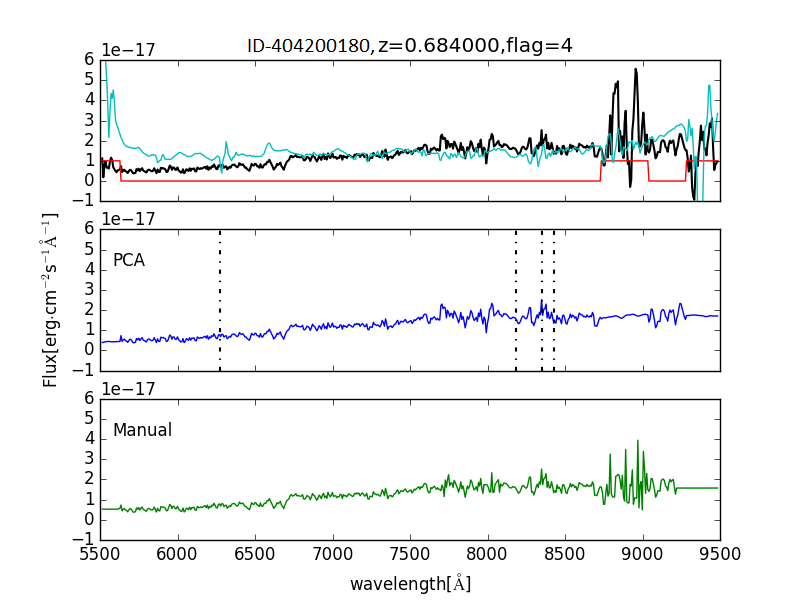
Fig. 13
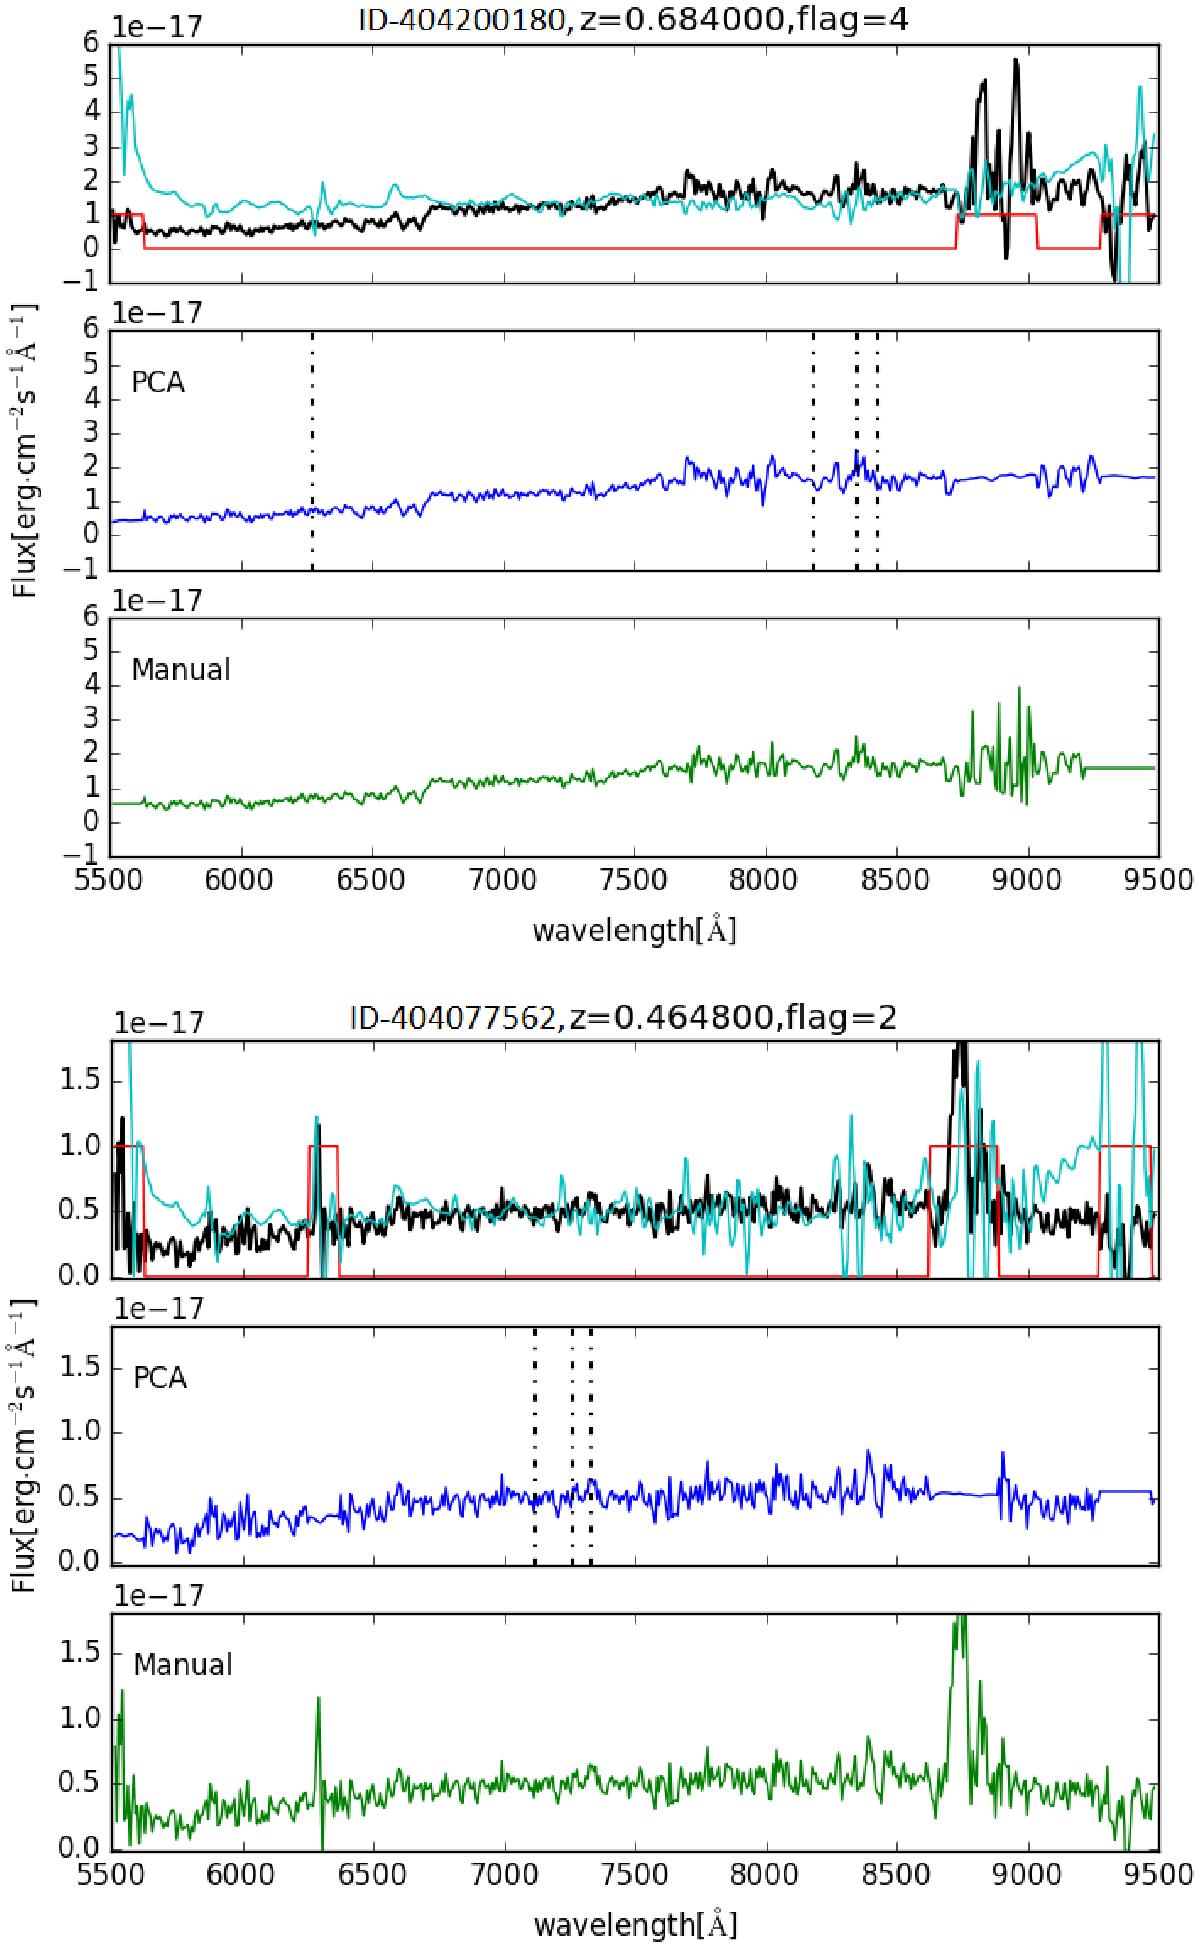
Cleaning of a Flag 4 (top) and a Flag2 (bottom) VIPERS spectrum. For each panel: the upper plot is the observed (sky subtracted) spectrum (thick black), superposed to the mask (straight red lines) and the rescaled sky residuals spectrum (thin cyan); the middle plot shows the automatic cleaning, with the expected position of the [OII], Hβ and [OIII] lines marked in black by the dash-dotted lines; and the bottom plot is the manually edited spectrum.
Current usage metrics show cumulative count of Article Views (full-text article views including HTML views, PDF and ePub downloads, according to the available data) and Abstracts Views on Vision4Press platform.
Data correspond to usage on the plateform after 2015. The current usage metrics is available 48-96 hours after online publication and is updated daily on week days.
Initial download of the metrics may take a while.