Fig. 4
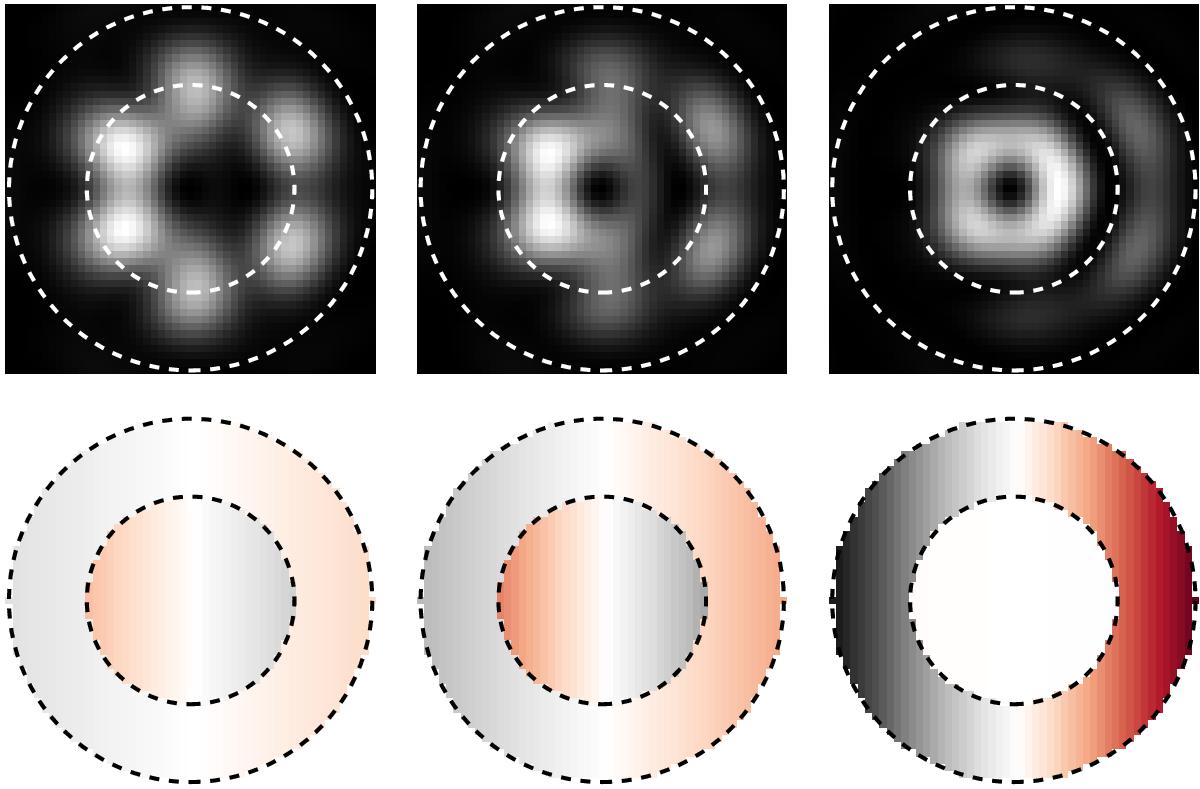
Top: simulated images for different tip-tilt amplitudes applied to the right along the horizontal axis, from left to right: 0.1 λ/DL, 0.16λ/DL and 0.38 λ/DL. Each displayed image is normalized by its maximal value. The dotted circles show the boundaries for the inner and outer areas. Bottom: color-coded representation of the flux asymmetry to emphasize the visual comparison of the asymmetry in the different images. The amplitude of the gradient is equal to the measured differential intensity and all images are shown with the same color scale.
Current usage metrics show cumulative count of Article Views (full-text article views including HTML views, PDF and ePub downloads, according to the available data) and Abstracts Views on Vision4Press platform.
Data correspond to usage on the plateform after 2015. The current usage metrics is available 48-96 hours after online publication and is updated daily on week days.
Initial download of the metrics may take a while.