Fig. 13
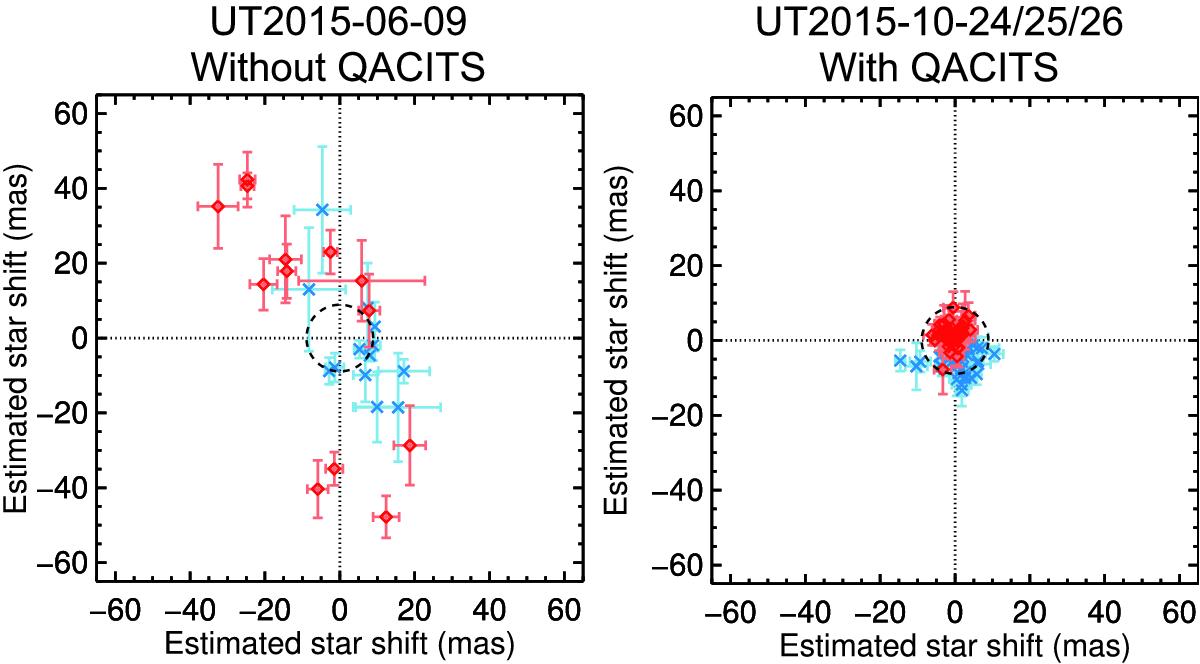
On-sky results from the QACITS post-monitoring of data sets taken during the night of first light (left) and on a later run in October with the control loop closed (right). Every point represents the mean estimate of a sequence (comprising between eight and 72 acquisition frames, ten in average), with the error bars showing the standard deviation of the estimates during the sequence. The dashed circles have a radius of 0.1 λ/DL = 9 mas.
Current usage metrics show cumulative count of Article Views (full-text article views including HTML views, PDF and ePub downloads, according to the available data) and Abstracts Views on Vision4Press platform.
Data correspond to usage on the plateform after 2015. The current usage metrics is available 48-96 hours after online publication and is updated daily on week days.
Initial download of the metrics may take a while.