Free Access
Fig. 9
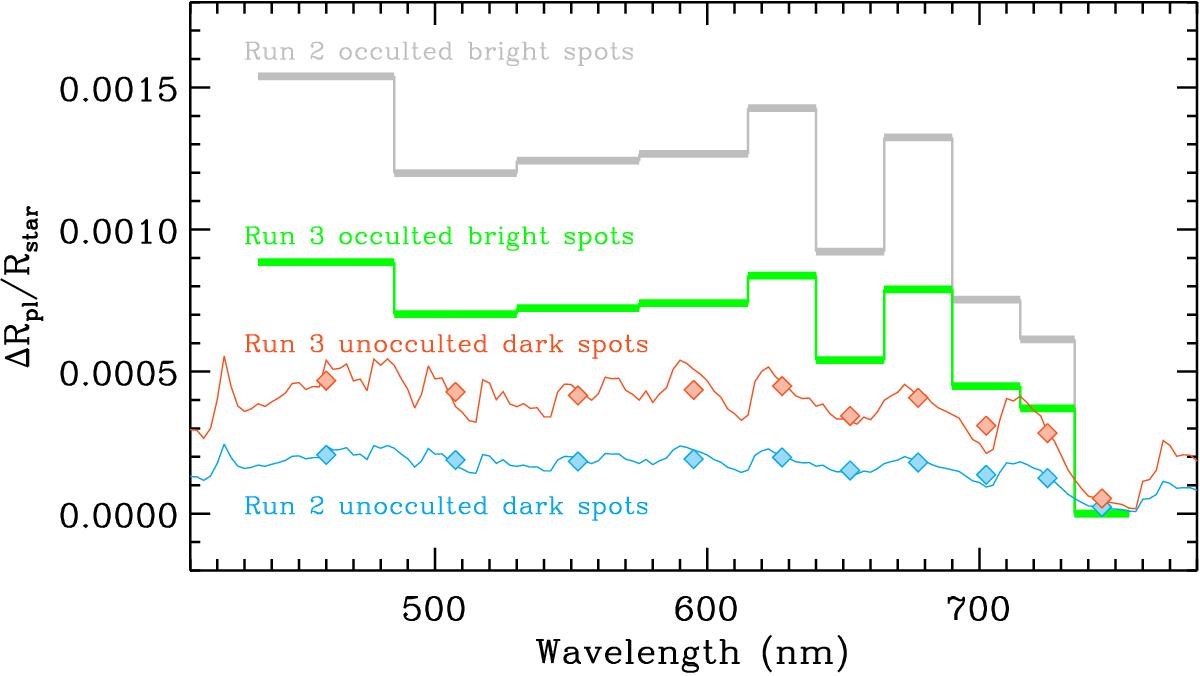
Impact of stellar activity on a flat constant line. These apparent relative transmission spectra were calculated using the fitting results obtained in Sect. 4.2 for the cases of unocculted dark spots (lines with diamonds) and occulted bright spots (histogram lines), respectively.
Current usage metrics show cumulative count of Article Views (full-text article views including HTML views, PDF and ePub downloads, according to the available data) and Abstracts Views on Vision4Press platform.
Data correspond to usage on the plateform after 2015. The current usage metrics is available 48-96 hours after online publication and is updated daily on week days.
Initial download of the metrics may take a while.