Fig. 5
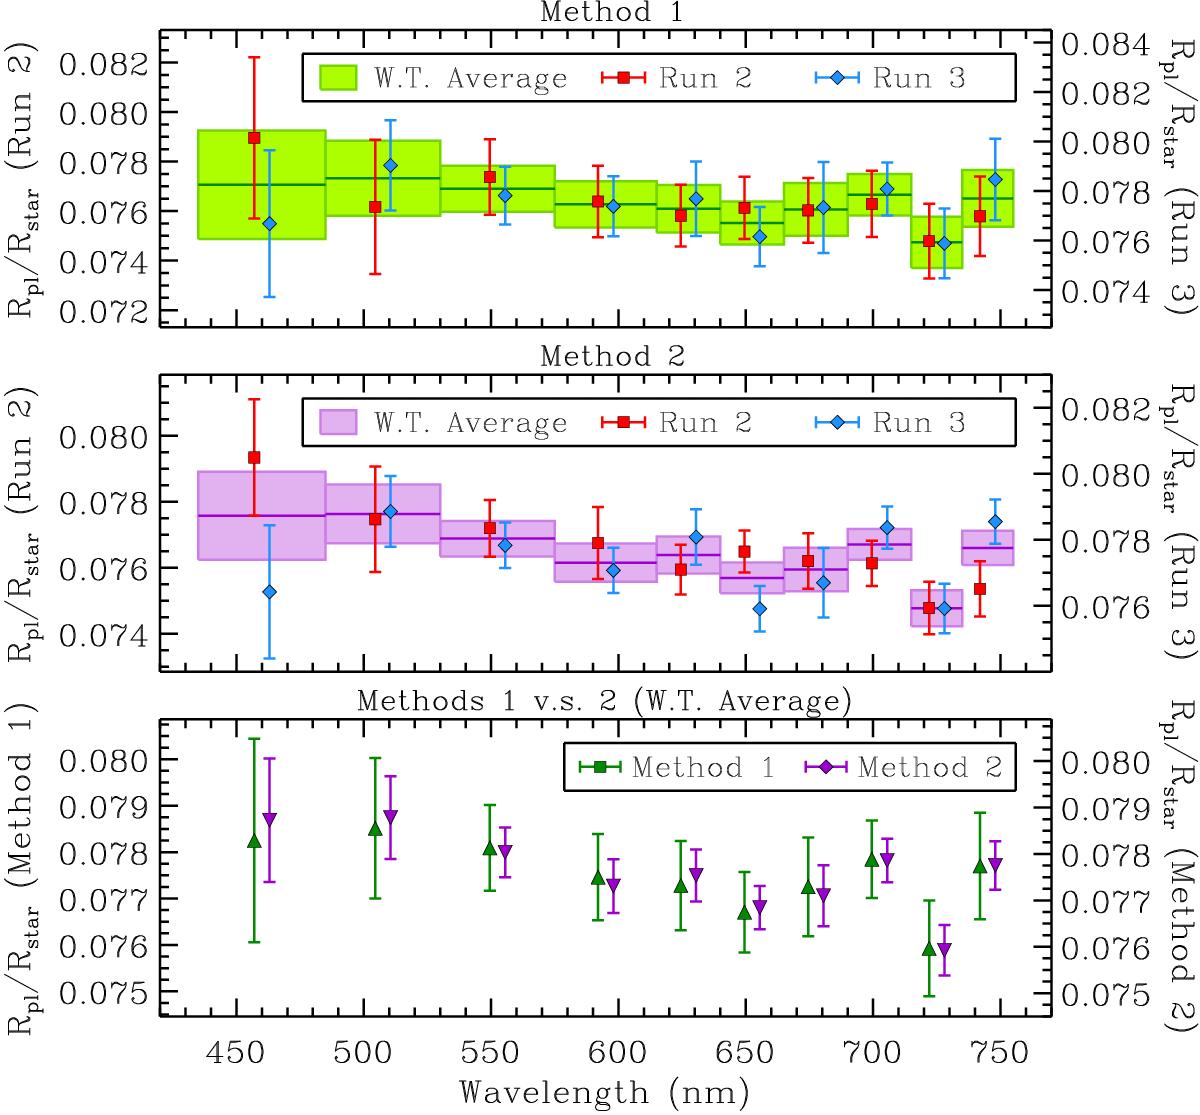
GTC/OSIRIS transmission spectra derived by different methods. Method 1 (top panel) refers to the Bayesian Information Criterion based model selection. Method 2 (middle panel) refers to the Akaike Information Criterion based systematics models marginalization. The single-Run transmission spectra are shown in red and blue for Runs 2 and 3, respectively. The shadowed boxes are the weighted average of the two nights, which are also separately shown in the bottom panel. The two data sets in each panel are shifted in wavelength for clarity.
Current usage metrics show cumulative count of Article Views (full-text article views including HTML views, PDF and ePub downloads, according to the available data) and Abstracts Views on Vision4Press platform.
Data correspond to usage on the plateform after 2015. The current usage metrics is available 48-96 hours after online publication and is updated daily on week days.
Initial download of the metrics may take a while.