Fig. 3
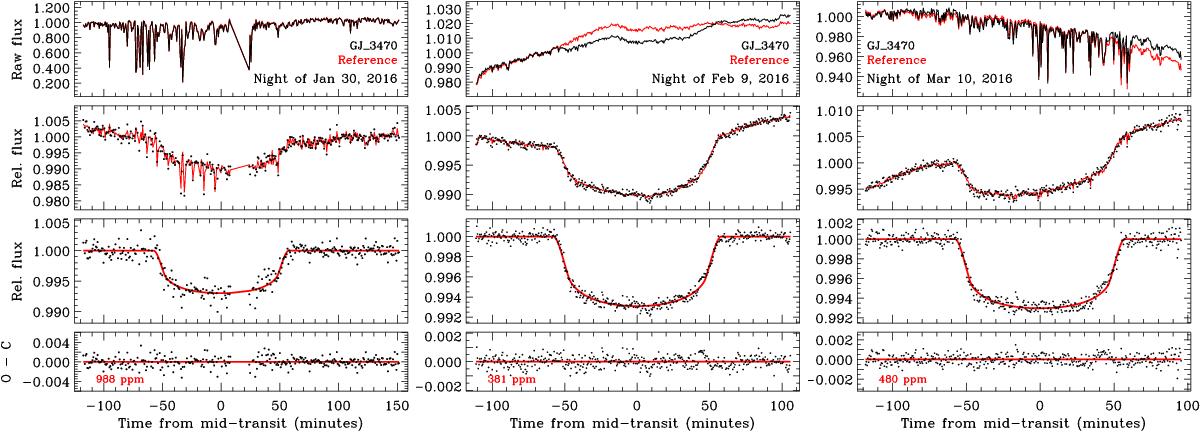
White-color light curves of GJ 3470 obtained with GTC/OSIRIS on January 30 (Run 1; left panel), February 9 (Run 2; middle panel), and March 10 (Run 3; right panel) in 2016. In each panel, from top to bottom are: (1) raw flux time series of the target (black line) and reference (red line) stars; (2) raw light curve (target-to-reference flux ratio; black points) and the best-fitting combined model (red line); (3) corrected light curve after removing the best-fitting systematics model, overplotted with the best-fitting transit model; (4) best-fitting light-curve residuals.
Current usage metrics show cumulative count of Article Views (full-text article views including HTML views, PDF and ePub downloads, according to the available data) and Abstracts Views on Vision4Press platform.
Data correspond to usage on the plateform after 2015. The current usage metrics is available 48-96 hours after online publication and is updated daily on week days.
Initial download of the metrics may take a while.