Fig. 11
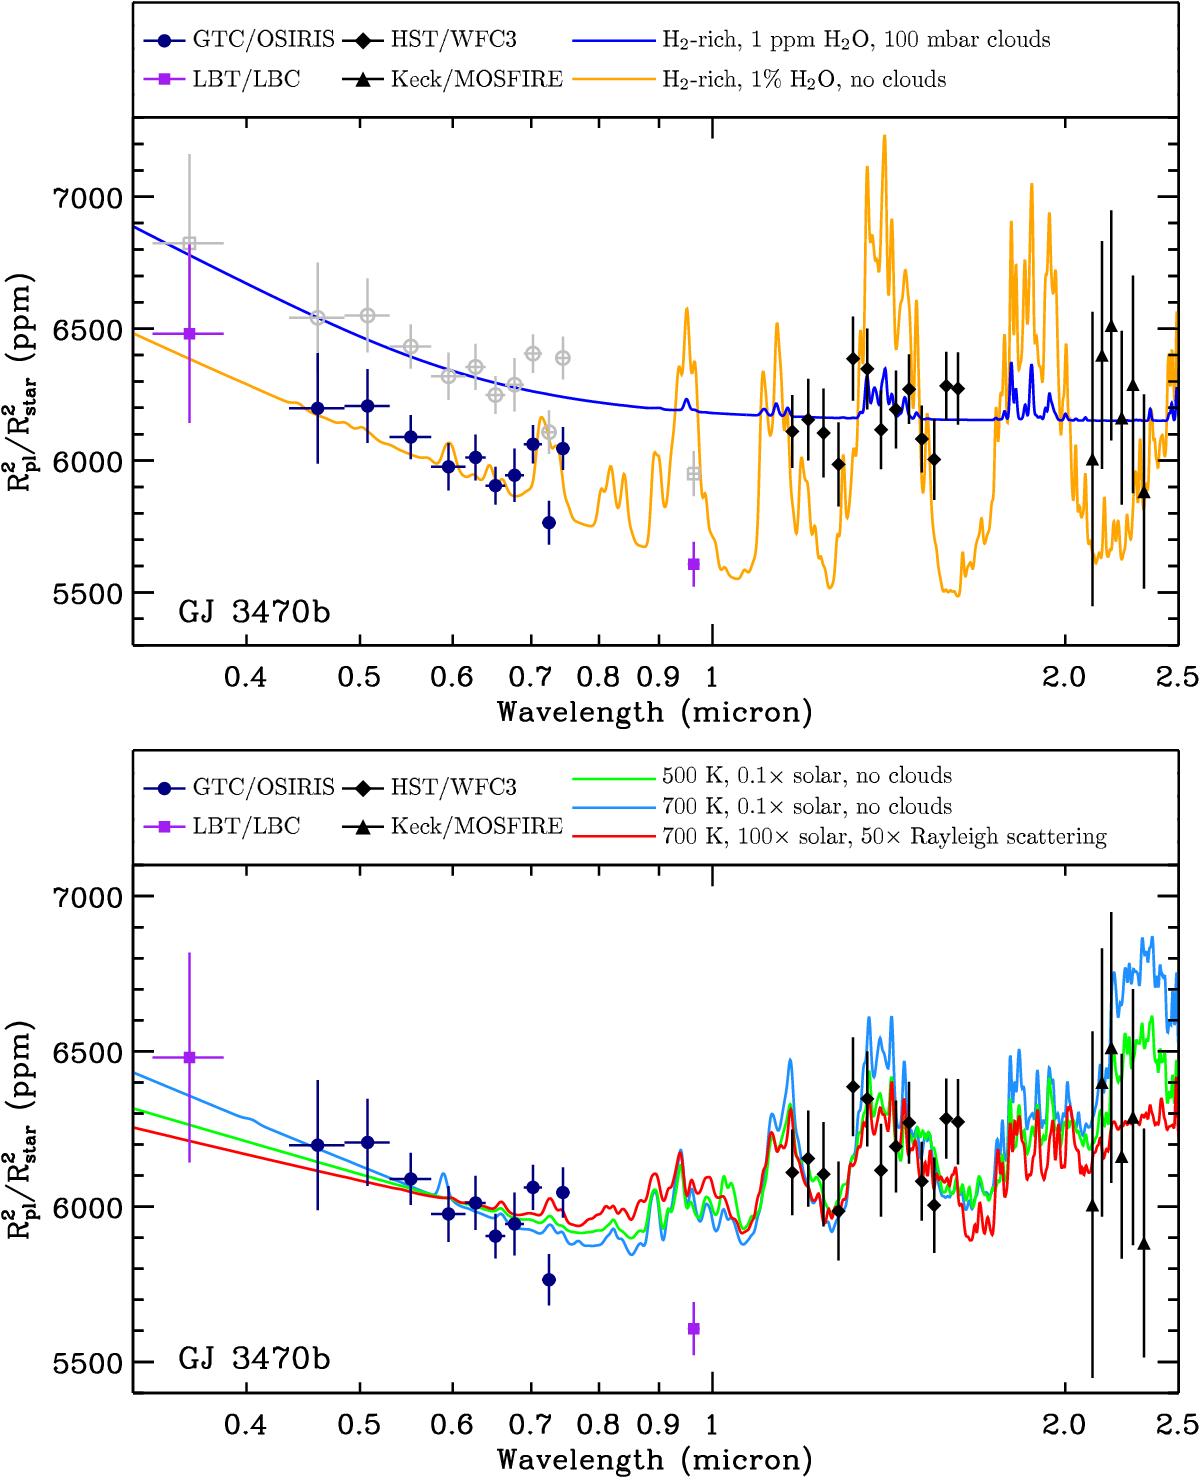
Transmission spectrum of GJ 3470b, which includes the transit depth measurements from GTC/OSIRIS (navy-blue circles), LBT/LBC (purple squares), HST/WFC3 (black diamonds), and Keck/MOSFIRE (black triangles). The two models shown in the top panel are taken from Ehrenreich et al. (2014), which correspond to H2-rich atmospheres with 1 ppm H2O and clouds at 100 mbar (blue) or with 1% H2O and no clouds (orange), respectively. The three models shown in the bottom panel are computed using the Exo-Transmit code (Kempton et al. 2017). In the top panel, the GTC/OSIRIS+LBT/LBC measurements are shifted upwards 343 ppm, and then shown as empty symbols in gray.
Current usage metrics show cumulative count of Article Views (full-text article views including HTML views, PDF and ePub downloads, according to the available data) and Abstracts Views on Vision4Press platform.
Data correspond to usage on the plateform after 2015. The current usage metrics is available 48-96 hours after online publication and is updated daily on week days.
Initial download of the metrics may take a while.