Fig. 10
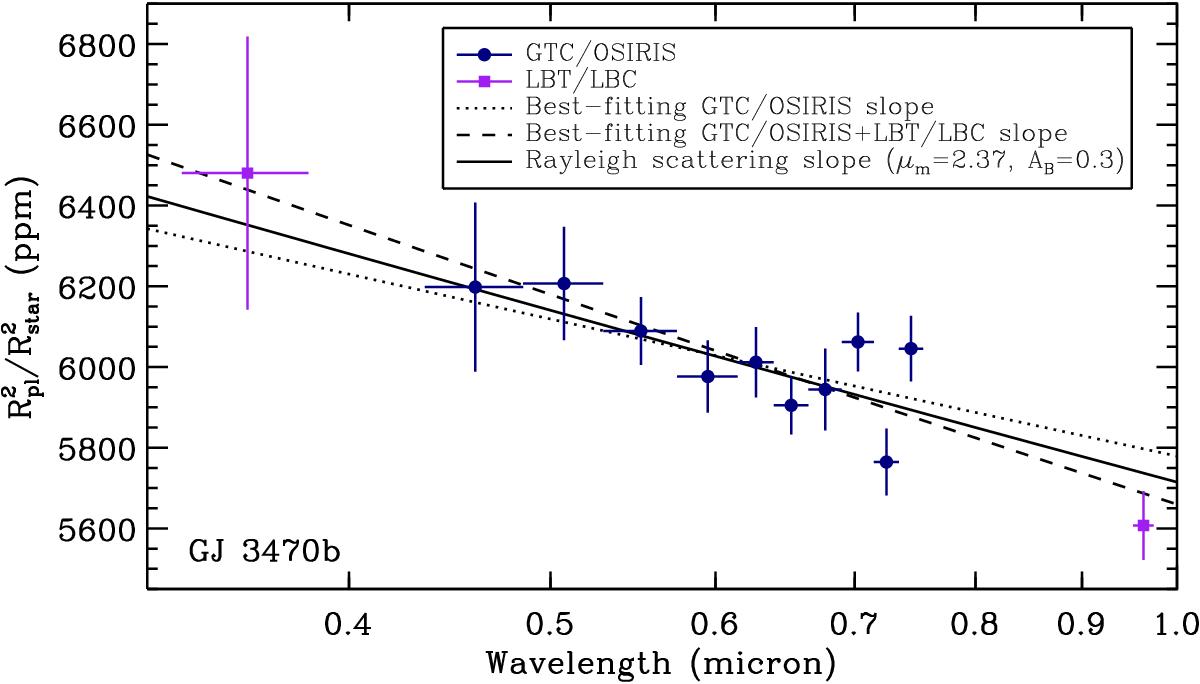
Optical transmission spectrum of GJ 3470b. The GTC/OSIRIS measurements and re-analyzed LBT/LBC measurements are shown in navy-blue circles and purple squares with error bars, respectively. The dotted line shows the best-fitting slope of the GTC/OSIRIS measurements. The dashed line shows the best-fitting slope of the combined GTC/OSIRIS and LBT/LBC measurements. The solid line shows a Rayleigh scattering slope based on the physical parameters of GJ 3470b with a mean molecular weight of μm = 2.37 and a Bond albedo of AB = 0.3.
Current usage metrics show cumulative count of Article Views (full-text article views including HTML views, PDF and ePub downloads, according to the available data) and Abstracts Views on Vision4Press platform.
Data correspond to usage on the plateform after 2015. The current usage metrics is available 48-96 hours after online publication and is updated daily on week days.
Initial download of the metrics may take a while.