| Issue |
A&A
Volume 600, April 2017
|
|
|---|---|---|
| Article Number | A133 | |
| Number of page(s) | 6 | |
| Section | Stellar structure and evolution | |
| DOI | https://doi.org/10.1051/0004-6361/201630196 | |
| Published online | 13 April 2017 | |
EXors and the stellar birthline
1 Department of Astrophysical Sciences, Princeton University, Princeton, NJ 08544, USA
e-mail: mm46@princeton.edu
2 Astronomy Department, University of California, Berkeley, CA 94720, USA
e-mail: Sstahler@astro.berkeley.edu
Received: 6 December 2016
Accepted: 23 February 2017
We assess the evolutionary status of EXors. These low-mass, pre-main-sequence stars repeatedly undergo sharp luminosity increases, each a year or so in duration. We place into the HR diagram all EXors that have documented quiescent luminosities and effective temperatures, and thus determine their masses and ages. Two alternate sets of pre-main-sequence tracks are used, and yield similar results. Roughly half of EXors are embedded objects, i.e., they appear observationally as Class I or flat-spectrum infrared sources. We find that these are relatively young and are located close to the stellar birthline in the HR diagram. Optically visible EXors, on the other hand, are situated well below the birthline. They have ages of several Myr, typical of classical T Tauri stars. Judging from the limited data at hand, we find no evidence that binarity companions trigger EXor eruptions; this issue merits further investigation. We draw several general conclusions. First, repetitive luminosity outbursts do not occur in all pre-main-sequence stars, and are not in themselves a sign of extreme youth. They persist, along with other signs of activity, in a relatively small subset of these objects. Second, the very existence of embedded EXors demonstrates that at least some Class I infrared sources are not true protostars, but very young pre-main-sequence objects still enshrouded in dusty gas. Finally, we believe that the embedded pre-main-sequence phase is of observational and theoretical significance, and should be included in a more complete account of early stellar evolution.
Key words: stars: formation / stars: pre-main sequence / stars: protostars / stars: variables: T Tauri, Herbig Ae/Be / accretion, accretion disks
© ESO, 2017
1. Introduction
Pre-main-sequence stars of low mass sometimes exhibit dramatic, if transient, episodes of greatly enhanced luminosity. The most well-known example is that of FUors. Here, the luminosity increases in about a year, while the subsequent decline stretches over many decades. Whether a given star undergoes repeated FUor outbursts is a matter of longstanding speculation (Herbig 1977); no such multiple events have ever been observed. In the other class of erupting young stars, known as EXors, the situation is different (Herbig 1989). The luminosity again increases in about a year or less, but the decay is much faster than in FUors, lasting a few years at most. In many instances, the same star has been observed to erupt several times.
EXor outbursts have been studied observationally in considerable detail (see, e.g., Aspin & Reipurth 2009). It is also possible to observe, in equal detail, the star in its quiescent state, an opportunity that is not available for FUors. Nevertheless, the basic physical mechanism underlying EXor outbursts is still unknown. The observation of inverse P Cygni profiles during several outbursts argues that enhanced accretion onto the star is occurring, presumably from a circumstellar disk (Herbig 2008). The fact that optically visible EXors are classical T Tauri stars, and thus surrounded by disks, is at least consistent with this picture. More generally, there has been qualitative speculation, supported quantitatively by modeling, that intermittent accretion through a disk is a phenomenon that begins in the earlier, protostar phase, when the star is still acquiring the bulk of its mass from its parent dense core (e.g., Baraffe et al. 2009). Some researchers have further hypothesized that even pre-main-sequence stars continue to gain mass for some time through bursts of disk accretion. In this view, all stars pass through an EXor phase in their youth (Hartmann 2009, Fig. 1.12).
In this brief paper, we seek to move beyond speculation and elucidate the true evolutionary status of EXors. Are they young pre-main-sequence stars, true protostars, or neither? We address these questions empirically, by placing the known members of the class in the HR diagram, according to their quiescent luminosities and effective temperatures. We find that “classical” EXors, those which are optically visible in quiescence, are not exceptionally young, but fall in the same region of the diagram as the bulk of classical T Tauri stars. However, this is not the full story, as dedicated infrared surveys have uncovered a second class of EXors (Lorenzetti et al. 2012). These are optically invisible prior to outburst, although they may have detectable optical flux during the relatively brief outburst itself. Such embedded EXors, we find, are indeed very young. In the HR diagram, they generally lie close to the stellar birthline, indicating that they recently transitioned from the protostar phase. Whether protostars themselves undergo repeated outbursts is still an open question. In any case, the EXor phenomenon occurs in only a small fraction of pre-main-sequence objects, where it persists from the earliest, post-infall epoch to the final disappearance of surface activity. Moreover, since many embedded EXors are Class I infrared sources, that category is not composed solely of true protostars, as has long been assumed (Adams et al. 1987).
In Sect. 2 below, we summarize the relevant data on the EXor population, placing as many sources as possible in the HR diagram. In addition to finding stellar masses and ages, we also assess from published observations whether binary companions could be triggering the eruptions. Section 3 discusses the broader implications of our results, and indicates promising avenues for further study.
2. Finding masses and ages
2.1. Motivation
To date, the known number of EXors is a few dozen. Although this figure would certainly increase with more systematic monitoring, EXors still represent a tiny minority of all observed T Tauri stars. An analogous statement holds for the population of FUors. It may nevertheless be true that every pre-main-sequence star undergoes FUor-type outbursts, provided the (unknown) period between eruptions is long enough (Herbig 1977). It is not possible to argue similarly for EXor-type outbursts, which are observed to recur in the same star over decade-long intervals. Whatever its cause, the EXor phenomenon is intrinsically rare within the pre-main-sequence population.
This rarity may reflect the fact that only the very youngest stars periodically erupt. Pre-main-sequence evolution is, after all, a decelerating process. A star close to the birthline shrinks by a factor of two in radius much faster than does a star just above the zero-age main sequence. Moreover, the star may be flaring because matter from its disk is impacting the stellar surface. A number of researchers have suggested that such intermittent disk accretion is the means by which true protostars acquire mass from their parent dense cores (e.g., Enoch et al. 2009). The EXor phenomenon may be, in some sense, a vestige of the earlier process. As the star ages, this transient behavior fades away.
There is already evidence, of a statistical nature, that significant photometric variability (as opposed to smaller-amplitude fluctuations) preferentially occurs in younger objects. For example, Antoniucci et al. (2014) compared the mid-infrared fluxes of stars detected by the Spitzer and WISE satellites. From this comparison, they identified 34 variable sources. The plurality of these variables had Class I spectral energy distributions (SEDs). Less common were Class II sources, and even rarer were Class IIIs. Under the conventional assumption that higher class number correlates with greater age, this result bolsters the view that substantial variability, including EXor-type eruptions, is a less common occurrence in relatively older stars.
2.2. Basic data
We now examine the evolutionary issue in more detail within the population of identified EXors, by placing these objects in the HR diagram, and thereby determining ages on a star-by-star basis. Accordingly, we have culled from the literature luminosities and effective temperatures for as many sources as possible. Both quantities refer to the quiescent phase of the star in question. That is, we have used either archival data obtained before an outburst, or more recent observations taken long enough after an outburst that both L⋆ and Teff had settled back to steady values.
Observed properties of EXors.
Table 1 displays the results of this literature search. Here, we list all known EXors, apart from several (e.g., NY Ori; Lorenzetti et al. 2007), for which luminosities and stellar temperatures are unavailable1. The most commonly used name for each source is in the first column, followed by its SED classification, according to the now-standard scheme (Lada & Wilking 1984; André et al. 1993; Greene et al. 1994). Again, the SED used for this purpose refers only to the quiescent state.
Some researchers have speculated that the outbursts may be caused by the tidal influence of an orbiting binary companion (e.g., Reipurth & Aspin 2004). To check this hypothesis, we have indicated, in the third column, whether a companion has been detected, either visually (v) or spectroscopically (s). Note that, in most cases where a search has been conducted, the EXor indeed has a companion. We remark further on the possible connection to outbursts in Sect. 2.5 below.
The fourth and fifth columns of Table 1 give L∗ and Lbol, the stellar and the quiescent bolometric luminosities, respectively. Authors obtained the stellar luminosity either by model-fitting to the SED (e.g. Sipos & Kóspál 2014) or by applying a bolometric correction to a dereddened near-infrared flux (e.g. Gras-Velázquez & Ray 2005). The bolometric luminosity was derived by integrating under the SED, with one exception (see Sect. 2.3 below). In the sixth column is the peak value of Lbol during outburst, where we have adopted an average when appropriate. In the seventh column is Teff, which we usually obtained from an estimated spectral type in the literature.
In the eighth column, we give R, a new measure of the degree to which a star is embedded in circumstellar dust. The traditional SED class already conveys this information in part. However, we want to distinguish those EXors which are optically visible in quiescence from those which are not. We define our index in terms of the specific flux Fλ as  (1)where
  is measured at 12 μm, and
  in the V-band. The mid-infrared wavelength is chosen for convenience, as it is one of those covered in the all-sky survey conducted by the WISE satellite (Wright et al. 2010). In those sources that are currently undetected in the V-band, we list a lower bound for R, based on an existing measurement at I or J2.
We define “classical” EXors as those for which R< 10 . Here, we have followed the nomenclature of Lorenzetti et al. (2012), although those authors did not employ our quantitative definition. The remaining EXors, for which R> 10 , we designate as “embedded”. These are listed below the heavy horizontal line in Table 1. Finally, the rightmost column gives the literature references we have used to complete the various entries.
2.3. EXor luminosities
The embedded EXors in Table 1 have values of Lbol that were mostly derived by integration of their SEDs. In some cases, however, researchers have not performed the detailed modeling required to obtain the purely stellar luminosity, L∗. But these two measures of luminosity cannot differ greatly, even for the most visually obscured sources.
To see why, note first that all EXors exhibit similar spikes and subsequent decays in energy output, even if these events are observed at very different wavelengths. Moreover, the eruptions repeat in the same manner. For example, the embedded source V2492 Cyg was recently observed to flare after a four-year interval (Arkharov et al. 2015). Now the visible members of the EXor class are known to be pre-main-sequence stars. Their identical behavior argues that the embedded members are too. This fact is key.
It is generally accepted that whatever excess luminosity a star emits beyond photospheric arises through accretion from its circumstellar disk. Since EXors are pre-main-sequence objects, as opposed to protostars, disk gas that spirals inward is not replenished by infall from whatever remnant cloud still exists. The fact that there is excess luminosity signifies that the disk is losing mass, even during quiescence. We denote this excess luminosity by Lacc, since it stems from disk accretion. That is,  where M∗ and R∗ are the stellar mass and radius, respectively, and Ṁ is the steady (quiescent) rate of mass transfer from the disk onto the star.
Suppose, contrary to our assertion, that Lacc greatly exceeded L∗. Then, from Eq. (3),  (4)from which it follows that
  (5)The righthand expression in Eq. (5) is the Kelvin-Helmholtz time tKH, the interval over which the star contracts significantly. The equation itself tells us that the star gains a large amount of mass in a time brief compared to tKH. This is a circumstance that holds for protostars, not pre-main-sequence stars such as EXors (Stahler & Palla 2004, Chap. 11).
All measurements to date of Md, the typical mass of a disk orbiting a pre-main-sequence star, have found this quantity to be far less than M∗ (for a recent compilation, see Cieza et al. 2015). Under our hypothesis, it would also follow that  (6)The disk would lose all its mass quickly, and this mass would not be replenished by the parent cloud. Since EXors still have disks, our initial supposition must have been incorrect. The true inequality is milder:
  (7)and indeed holds for most EXors in the table for which both luminosities have been determined3. To place any star in the HR diagram, we may, with sufficient accuracy, employ Lbol instead of L∗. We have done so whenever the latter quantity was unavailable.
2.4. Results
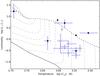 |
Fig. 1 EXors in the HR diagram. Filled and open circles represent embedded and classical EXors, respectively. Each source is plotted according to its quiescent luminosity and effective temperature. The upper, heavy dashed curve is the stellar birthline of Palla & Stahler (1990), and the lower, heavy solid curve is the zero-age main sequence. The lighter dashed curves are the pre-main-sequence evolutionary tracks of Palla & Stahler (1999). From right to left, the corresponding stellar masses, in solar units, are: 0.1, 0.2, 0.4, 0.6, 0.8, 1.0, 1.2, 1.5, 2.0, 2.5, 3.0 and 3.5. |
Figure 1 displays all the EXors listed in Table 1 within the HR diagram. We have added, for each star, error bars in luminosity and effective temperature, whenever this information was available. The lower, solid curve in the diagram is the zero-age main sequence, while the upper, dashed one is the stellar birthline, i.e., the locus along which pre-main-sequence stars first appear following their protostar phase (Palla & Stahler 1990). The lighter dashed curves connecting the birthline and zero-age main sequence are the pre-main-sequence evolutionary tracks of Palla & Stahler (1999). The stellar masses corresponding to each track are given in the figure caption.
We have indicated by filled circles the embedded EXors, while open circles mark the classical EXors. It is immediately clear that most embedded sources are situated relatively high in the diagram, and in fact lie close to the stellar birthline. Classical EXors are in a different location, grouped in the same region of the diagram as ordinary, classical T Tauri stars.
To be sure, there are exceptions to this general pattern, and it may be of interest to consider them individually. One source, V2493 Cyg, is classical as judged by its R-value, yet lies close to the birthline. We find it telling that the object’s SED is atypical for classical EXors, and has a flat-spectrum appearance in the near- to mid-infrared (Antoniucci et al. 2013, Fig. 3). Conversely, two ostensibly embedded EXors lie within the classical region. The one with the higher Teff-value is V1180 Cas, and is unusual in its light curve. As seen in Fig. 2 of Kun et al. (2011b), its last two outbursts were so extended and close in time that the star may actually be undergoing periodic decreases of luminosity with time4.
Finally, the embedded EXor of relatively low L∗ and Teff is XZ Tau. The XZ Tau system is actually a classical T Tauri binary, and our L∗ and Teff refer to the component XZ Tau North. This star brightened by 3 mag in the R-band from 1998 to 2001 (Coffey et al. 2004); we can find no detailed account of its subsequent photometric behavior. In any case, the source is complex both temporally and spatially. One or both components have launched multiple bubbles and knots, presumably driven by stellar jets (Krist et al. 2008).
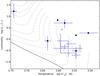 |
Fig. 2 EXors in the HR diagram. All curves and symbols have the same meaning as in Fig. 1, but the pre-main-sequence evolutionary tracks of Tognelli et al. (2011) are shown instead. From right to left, the corresponding stellar masses, in solar units are: 0.20, 0.40, 0.60, 0.80, 1.0, 1.2, 1.5, 2.0, 2.6, 3.0 and 3.6. |
In order to have a second, independent measure of stellar masses and ages, we have displayed, in Fig. 2, the same EXors in an HR diagram with the more recent pre-main-sequence tracks of Tognelli et al. (2011). These authors used an updated equation of state and, unlike Palla & Stahler (1999), supplemented their calculation of the internal evolution with stellar atmosphere models. Since they considered only the pre-main-sequence phase, they began each track at a relatively large, but arbitrary radius, and did not calculate a birthline. Needless to say, the same segregation of embedded and classical EXors is apparent here.
Table 2 lists the derived ages and masses for our sample. Here, we show the results using both the pre-main-sequence tracks of Palla & Stahler (1999) and of Tognelli et al. (2011). With the exception of the classical EXor EC 53, the derived values for both quantities are in good agreement. As in Table 1, those sources below the horizontal line are the embedded EXors. Most of these nominally lie above both sets of tracks, so that we were only able to derive masses and ages for three stars. One is the UXor-like V1180 Cas, which has an anomalously high age, using either set of tracks. Note finally that the embedded EXor source PV Cep, which has the mass of a Herbig Ae star, lies just below the birthline, but has an age of about 2 Myr. The reason is that this star is on a more horizontal, radiative, track that originates from a relatively distant point on the birthline.
Derived properties of EXors.
2.5. Remarks on binarity
Table 1 shows that most EXors are binaries. Superficially, this fact lends support to the hypothesis that binary companions trigger periodic luminosity eruptions in the primary star. To explore the connection more quantitatively, we compare the measured or estimated binary periods P with Δtint , the observed interval between outbursts. We were able to obtain this interval for only five stars, and display the results in Table 3. Here the stars are listed in order of their ages. (Both these ages and the stellar masses, also listed, are means from the two sets of tracks.) The values of Δtintwere obtained by averaging over all available observations. For the star V1118 Ori, the observed intervals ranged from 2 to 8 yr, but they were more tightly clustered for the other sources. The single embedded star, PV Cep, has an average Δtintof 25 yr, based on three consecutive outburts. This star is also the youngest of the five, and by far the most massive. The remaining stars in the table are all classical EXors, and have similar values of Δtint , about 4 yr.
Interval between bursts.
There are now three stars for which we can compare P and Δtint . The eponymous source EX Lupi is a spectroscopic binary with P = 7.4 days , but with Δ tint = 3.9 yr . For the two visual binaries, V1118 Ori and VY Tau, we may crudely estimate P using the mass of the primary only for the system mass and the observed separations (75 and 99 AU, respectively) for the semi-major axes. In this manner, we find P ~ 900 yrfor V1118 Ori and P ~ 1200 yrfor VY Tau, vastly different from Δ tint = 4.7 yrand 5.0 yr, respectively.
Based on this scant information, there is no evidence for a causal link between binarity and outbursts. Further exploration is clearly needed, i.e., a systematic search for binary companions with separations on the order of 1 au, so that their periods match the typical values of Δtint . Such an undertaking is daunting for embedded EXors, but may be feasible for the nearer, classical ones. Following variations in radial velocity is difficult with such active stars, and the binary separation is probably too close for imaging with speckle interferometry, even at the distance of Taurus (Duchêne 2016, priv. comm.). Yet another possibility is the ongoing Gaia mission, which can detect astrometric binaries with periods from several months to about 5 yr.
3. Discussion
In retrospect, the separation of classical and embedded EXors in the HR diagram is not entirely surprising, and in part could have been anticipated. Herbig (2008) summarized the observational data on a number of optically visible EXors. He noted that they are indistinguishable spectroscopically, at least in quiescence, from other classical T Tauri stars. Also unexceptional is their distribution in the (J-H, H-K) plane (see his Fig. 10). Our own finding thus confirms that these objects represent that small subset of classical T Tauri stars that undergo periodic outbursts. That we find no EXors even closer to the main sequence is, of course, consistent with the general lack of such objects, the venerable post-T Tauri problem (Stahler & Palla 2004, Chap. 12). But this deficit also suggests that the EXor phenomenon fades concurrently with other signs of surface activity, such as the presence of strong photospheric emission lines and enhanced X-ray emission.
What is the nature of embedded EXors? Stars that are optically invisible and detected only in the infrared could, in principle, be the same age as revealed objects, but viewed through edge-on disks. In such cases, however, the bolometric luminosity obtained by integration of the SED is abnormally low, since most of the star’s luminosity is channeled orthogonal to the disk and hence escapes detection (for an example of such an apparently under-luminous object, see Luhman et al. 2009). The fact that embedded EXors generally lie above their optical counterparts demonstrates that they are indeed younger, so young that they are still inside remnants of the dusty clouds that spawned them in the relatively recent past.
This finding also justifies, a posteriori, our utilization of Lbol in place of L∗ whenever necessary,. In other words, the location of embedded EXors corroborates the view that they are pre-main-sequence, as opposed to protostellar, objects, despite the appearance of their SEDs. Again, this result is not a complete surprise. The current estimate for the typical mass accretion rate of EXors, even accounting for the outbursts, is at most 10-7M⊙ yr-1 , too low for them to acquire the bulk of their mass through accretion (Lorenzetti et al. 2012). The more general point, apparently not yet appreciated, deserves emphasis. There exist low-mass stars that are no longer acquiring the bulk of their mass through infall, are contracting gravitationally, and yet are still obscured optically by circumstellar dust and gas. The existence of such embedded pre-main-sequence stars immediately raises questions. What is the physical environment of such an object, i.e., why is the remnant cloud not collapsing onto the central star? What becomes of the enshrouding material as time progresses?
We stated at the outset that the EXor phenomenon is rare, and that its origin is still unknown. The present study has not addressed the underlying physics of the outbursts, but our findings suggest that they persist from the earliest post-infall epoch to the fading of characteristic T Tauri surface activity. If EXor outbursts indeed arise from intermittent disk accretion, then there is apparently no link between such events and the presence or absence of nascent cloud material. Future investigators should clearly pursue both lines of inquiry – the environment of embedded pre-main-sequence stars and the nature of EXor outbursts – and thereby fill in the remaining gaps in our understanding of early stellar evolution.
We have omitted two sources that Lorenzetti et al. (2012) classified as EXors. The star OO Ser erupted in 1994−1995, but the subsequent decay time was a decade (Kóspál et al. 2006), in violation of our basic selection criterion. The star GM Cep has displayed rapid, low-amplitude (1−2 mag) oscillations in luminosity, not temporally isolated outbursts (Sicilia-Aguilar et al. 2008; Semkov et al. 2015).
We thank Dario Lorenzetti for providing R-values for all the sources in Table 1.
One apparent exception is the most massive EXor, PV Cep, for which Kun et al. (2011a) obtained an accretion luminosity by utilizing an empirical correlation between this quantity and the strength of Ca II emission.
Such decreases are reminiscent of the so-called UXor phenomenon Grinin et al. (1994). In these objects, however, it is only the visible flux that decreases, as a result of variable, circumstellar extinction.
Acknowledgments
Our project benefited greatly from extensive communication with Dario Lorenzetti. Dario generously provided us with a wealth of information, and more generally helped us navigate the observational complexities of this field. S.W.S. was partially funded by HST grant HST-GO-13826.017-A. This paper is dedicated to the memory of Francesco Palla.
References
- Adams, F. C., Lada, C. J., & Shu, F. H. 1987, ApJ, 312, 788 [NASA ADS] [CrossRef] [Google Scholar]
- André, P., Ward-Thompson, D., & Barsony, M. 1993, ApJ, 406, 122 [NASA ADS] [CrossRef] [Google Scholar]
- Antoniucci, S., Giannini, T., & Lorenzetti, D. 2013, New Astron., 23, 98 [NASA ADS] [CrossRef] [Google Scholar]
- Antoniucci, S., Giannini, T., Li Causi, G., & Lorenzetti, D. 2014, ApJ, 782, 51 [NASA ADS] [CrossRef] [Google Scholar]
- Antoniucci, S., Nucita, A. A., Giannini, T., et al. 2015, A&A, 584, A21 [NASA ADS] [CrossRef] [EDP Sciences] [Google Scholar]
- Arkharov, A. A., Lorenzetti, D., Ginannini, T., et al. 2015, ATel, 7436 [Google Scholar]
- Aspin, C. 2011, AJ, 141, 196 [NASA ADS] [CrossRef] [Google Scholar]
- Aspin, C., & Reipurth, R. 2009, AJ, 138, 1137 [NASA ADS] [CrossRef] [Google Scholar]
- Aspin, C., Beck, T. L., & Reipurth, B. 2008, AJ, 135, 423 [NASA ADS] [CrossRef] [Google Scholar]
- Aspin, C., Greene, T. P., & Reipurth, B. 2009, AJ, 137, 2968 [NASA ADS] [CrossRef] [Google Scholar]
- Audard, M., Stringfellow, G. S., Güdel, M., et al. 2010, A&A, 511, A63 [NASA ADS] [CrossRef] [EDP Sciences] [Google Scholar]
- Baraffe, I., Chabrier, G., & Gallardo, J. 2009, ApJ, 702, L27 [NASA ADS] [CrossRef] [Google Scholar]
- Basri, G., & Bertout, C. 1989, ApJ, 341, 340 [NASA ADS] [CrossRef] [Google Scholar]
- Cabrit, S., Edwards, S., Strom, S. E., & Strom, K. M. 1990, ApJ, 354, 687 [NASA ADS] [CrossRef] [Google Scholar]
- Caratti o Gáratti, A., Garcia Lopez, R., Scholz, A., et al. 2011, A&A, 526, L1 [NASA ADS] [CrossRef] [EDP Sciences] [Google Scholar]
- Caratti o Gáratti, A., Garcia Lopez, R., Antoniucci, S., et al. 2012, A&A, 538, A64 [NASA ADS] [CrossRef] [EDP Sciences] [Google Scholar]
- Cieza, L., Williams, J., Kourkchi, E., et al. 2015, MNRAS, 454, 1909 [NASA ADS] [CrossRef] [Google Scholar]
- Coffey, D., Downes, T. P., & Ray, T. P. 2004, A&A, 419, 593 [NASA ADS] [CrossRef] [EDP Sciences] [Google Scholar]
- Cohen, M., & Kuhi, L. V. 1979, ApJS, 41, 743 [NASA ADS] [CrossRef] [Google Scholar]
- Doppman, G. W., Greene, T. P., Covey, K. R., & Lada, C. J. 2005, AJ, 130, 1145 [Google Scholar]
- Enoch, M. L., Evans, N. J., Sargent, A. I., & Glenn, J. 2009, ApJ, 692, 973 [NASA ADS] [CrossRef] [Google Scholar]
- Gómez, M., & Mardones, D. 2003, AJ, 125, 2134 [NASA ADS] [CrossRef] [Google Scholar]
- Gras-Velázquez, A., & Ray, T. 2005, A&A, 443, 541 [NASA ADS] [CrossRef] [EDP Sciences] [Google Scholar]
- Greene, T. P., Wilking, B. A., André, P., Young, E. T., & Lada, C. J. 1994, ApJ, 434, 614 [NASA ADS] [CrossRef] [Google Scholar]
- Grinin, V. P., Thé, P. S., de Winter, D., et al. 1994, A&A, 292, 165 [NASA ADS] [Google Scholar]
- Guenther, E., & Hessman, F. V. 1993, A&A, 268, 192 [NASA ADS] [Google Scholar]
- Hartigan, P., & Kenyon, S. J. 2003, ApJ, 583, 334 [NASA ADS] [CrossRef] [Google Scholar]
- Hartmann, L. 2009, Accretion Processes in Star Formation (Cambridge: Cambridge U. Press) [Google Scholar]
- Herbig, G. H. 1977, ApJ, 217, 693 [NASA ADS] [CrossRef] [Google Scholar]
- Herbig, G. H. 1989, in Proc. ESO Workshop on Low-Mass Star Formation and Pre-Main-Sequence Objects (B. Reipurth, Munich: ESO), 233 [Google Scholar]
- Herbig, G. H. 2007, AJ, 133, 2679 [Google Scholar]
- Herbig, G. H. 2008, AJ, 135, 637 [NASA ADS] [CrossRef] [Google Scholar]
- Hillenbrand, L. A. 1997, AJ, 113, 1733 [NASA ADS] [CrossRef] [Google Scholar]
- Hodapp, K. W., Chini, R., Watermann, R., & Lemke, R. 2012, ApJ, 744, 56 [NASA ADS] [CrossRef] [Google Scholar]
- Kenyon, S. J., Hartmann, L., Hewett, R., et al. 1994, AJ, 107, 2153 [NASA ADS] [CrossRef] [Google Scholar]
- Kóspál. Á., Ábrahám, P., Prusti, T., et al. 2006, in Astrophysics of Variable Stars, eds. C. Sterken, & C. Aerts (San Francisco: ASP), ASP Conf. Ser., 349, 269 [Google Scholar]
- Kóspál, Á., Mohler-Fischer, M., Sicilia-Aguilar, A., et al. 2014, A&A, 561, A61 [NASA ADS] [CrossRef] [EDP Sciences] [Google Scholar]
- Krist, J. E., Stapelfeldt, K. R., Hester, J. J., et al. 2008, AJ, 136, 1980 [NASA ADS] [CrossRef] [Google Scholar]
- Kun, M., Szegedi-Elek, E., Moór, A., et al. 2011a, MNRAS, 413, 2689 [NASA ADS] [CrossRef] [Google Scholar]
- Kun, M., Szegedi-Elek, E., Moór, A., et al. 2011b, ApJ, 733, L8 [NASA ADS] [CrossRef] [Google Scholar]
- Lada, C. J., & Wilking, B. A. 1984, ApJ, 287, 610 [NASA ADS] [CrossRef] [Google Scholar]
- Lorenzetti, D., Giannini, T., Calzoletti, L., et al. 2006, A&A, 453, 579 [NASA ADS] [CrossRef] [EDP Sciences] [Google Scholar]
- Lorenzetti, D., Giannini, D., Larionov, V. M., et al. 2007, ApJ, 665, 1182 [NASA ADS] [CrossRef] [Google Scholar]
- Lorenzetti, D., Larionov, V. M., Giannini, T., et al. 2009, ApJ, 693, 1056 [NASA ADS] [CrossRef] [Google Scholar]
- Lorenzetti, D., Giannini, T., Larionov, V. M., et al. 2011, ApJ, 732, 69 [NASA ADS] [CrossRef] [Google Scholar]
- Lorenzetti, D., Antoniucci, S., Giannini, T., et al. 2012, ApJ, 749, 188 [NASA ADS] [CrossRef] [Google Scholar]
- Luhman, K., Mamajek, E. E., Allen, P. R., & Cruz, K. L. 2009, ApJ, 703, 399 [NASA ADS] [CrossRef] [Google Scholar]
- Miller, K. A., Smith, W. W., Ehrenreich, T., et al. 2011, ApJ, 730, 80 [NASA ADS] [CrossRef] [Google Scholar]
- Palla, F., & Stahler, S. W. 1990, ApJ, 360, 47 [Google Scholar]
- Palla, F., & Stahler, S. W. 1999, ApJ, 525, 772 [NASA ADS] [CrossRef] [Google Scholar]
- Persi, P., Tapia, M., & Gómez, M. 2007, AJ, 133, 1690 [NASA ADS] [CrossRef] [Google Scholar]
- Prato, L., Simon, M., Mazeh, T., Zucker, S., & McLean, I. S. 2002, ApJ, 579, L99 [NASA ADS] [CrossRef] [Google Scholar]
- Reipurth, B., & Aspin, C. 2004, ApJ, 608, L65 [Google Scholar]
- Reipurth, B., Guimaräes, M. M., Connelley, M. S., & Bally, J. 2007, AJ, 134, 2272 [NASA ADS] [CrossRef] [Google Scholar]
- Semkov, E., Ibryamov, S., Reneva, S., et al. 2015, PASA, 32, 11 [NASA ADS] [CrossRef] [Google Scholar]
- Sicilia-Aguilar, A., Merin, B., Hormuth, F., et al. 2008, ApJ, 673, 382 [NASA ADS] [CrossRef] [Google Scholar]
- Sipos, N., & Kóspál, Á. 2014, in Exploring the Formation and Evolution of Planetary Systems, IAU Symp., 299, 121 [NASA ADS] [Google Scholar]
- Sipos, N., Ábrahám, P., Acosta-Pulido, J., et al. 2009, A&A, 507, 881 [NASA ADS] [CrossRef] [EDP Sciences] [Google Scholar]
- Stahler, S., & Palla, F. 2004, The Formation of Stars (Weinheim: Wiley-VCH) [Google Scholar]
- Tognelli, E., Prada Moroni, P. G., & Degl’Innocenti, S. 2011, A&A, 533, A109 [NASA ADS] [CrossRef] [EDP Sciences] [Google Scholar]
- Wright, E. L., Eisenhardt, P. R. M., Mainzer, A. K., et al. 2010, AJ, 140, 1868 [NASA ADS] [CrossRef] [Google Scholar]
All Tables
All Figures
|
Fig. 1 EXors in the HR diagram. Filled and open circles represent embedded and classical EXors, respectively. Each source is plotted according to its quiescent luminosity and effective temperature. The upper, heavy dashed curve is the stellar birthline of Palla & Stahler (1990), and the lower, heavy solid curve is the zero-age main sequence. The lighter dashed curves are the pre-main-sequence evolutionary tracks of Palla & Stahler (1999). From right to left, the corresponding stellar masses, in solar units, are: 0.1, 0.2, 0.4, 0.6, 0.8, 1.0, 1.2, 1.5, 2.0, 2.5, 3.0 and 3.5. |
| In the text | |
|
Fig. 2 EXors in the HR diagram. All curves and symbols have the same meaning as in Fig. 1, but the pre-main-sequence evolutionary tracks of Tognelli et al. (2011) are shown instead. From right to left, the corresponding stellar masses, in solar units are: 0.20, 0.40, 0.60, 0.80, 1.0, 1.2, 1.5, 2.0, 2.6, 3.0 and 3.6. |
| In the text | |
Current usage metrics show cumulative count of Article Views (full-text article views including HTML views, PDF and ePub downloads, according to the available data) and Abstracts Views on Vision4Press platform.
Data correspond to usage on the plateform after 2015. The current usage metrics is available 48-96 hours after online publication and is updated daily on week days.
Initial download of the metrics may take a while.