Fig. 9
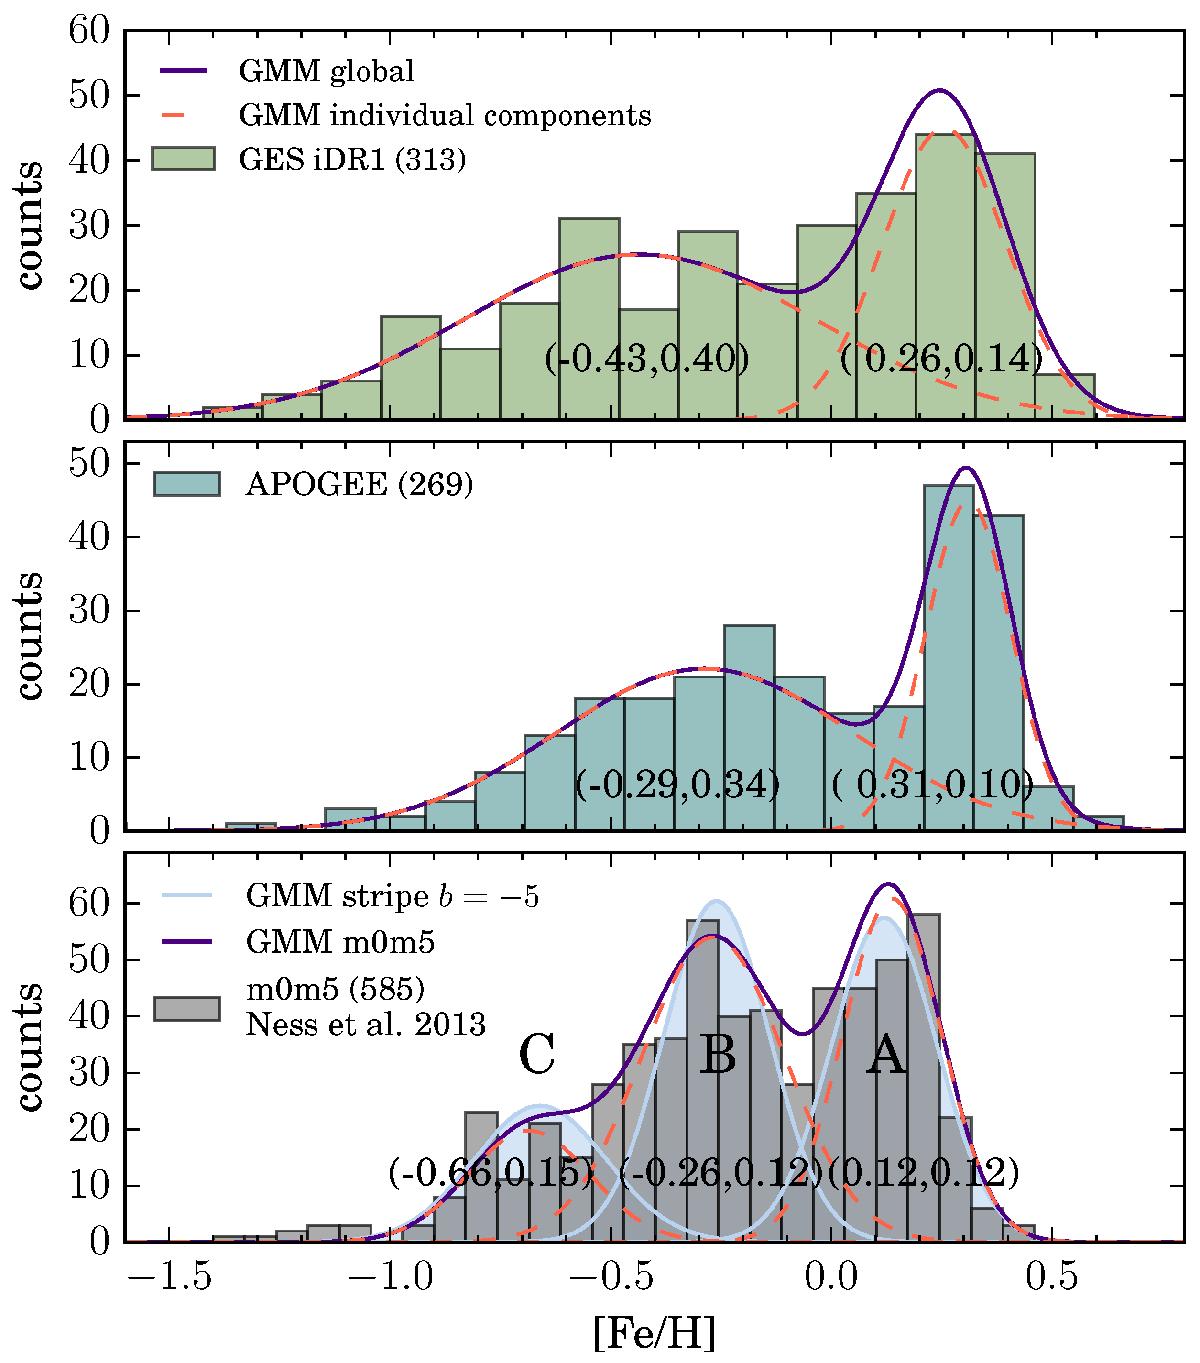
Metallicity distribution function for stars in BW. Only sources with RGC< 3.5 kpc are included. Top panel: MDF of the GES BW data (iDR1). Middle panel: MDF of the APOGEE data. In each case, the GMM decomposition is depicted by dashed (individual components) and solid (global profile) lines, with mean and width values in parentheses. Lower panel: MDF of the closest field to BW from ARGOS data (Ness et al. 2013). The GMM decomposition is depicted as in the other panels. For comparison, the GMM decomposition of the b = −5° strip, as taken from Ness et al. (2013), is depicted by the three Gaussian profiles, with the corresponding mean and width values quoted in parentheses.
Current usage metrics show cumulative count of Article Views (full-text article views including HTML views, PDF and ePub downloads, according to the available data) and Abstracts Views on Vision4Press platform.
Data correspond to usage on the plateform after 2015. The current usage metrics is available 48-96 hours after online publication and is updated daily on week days.
Initial download of the metrics may take a while.