Fig. 9
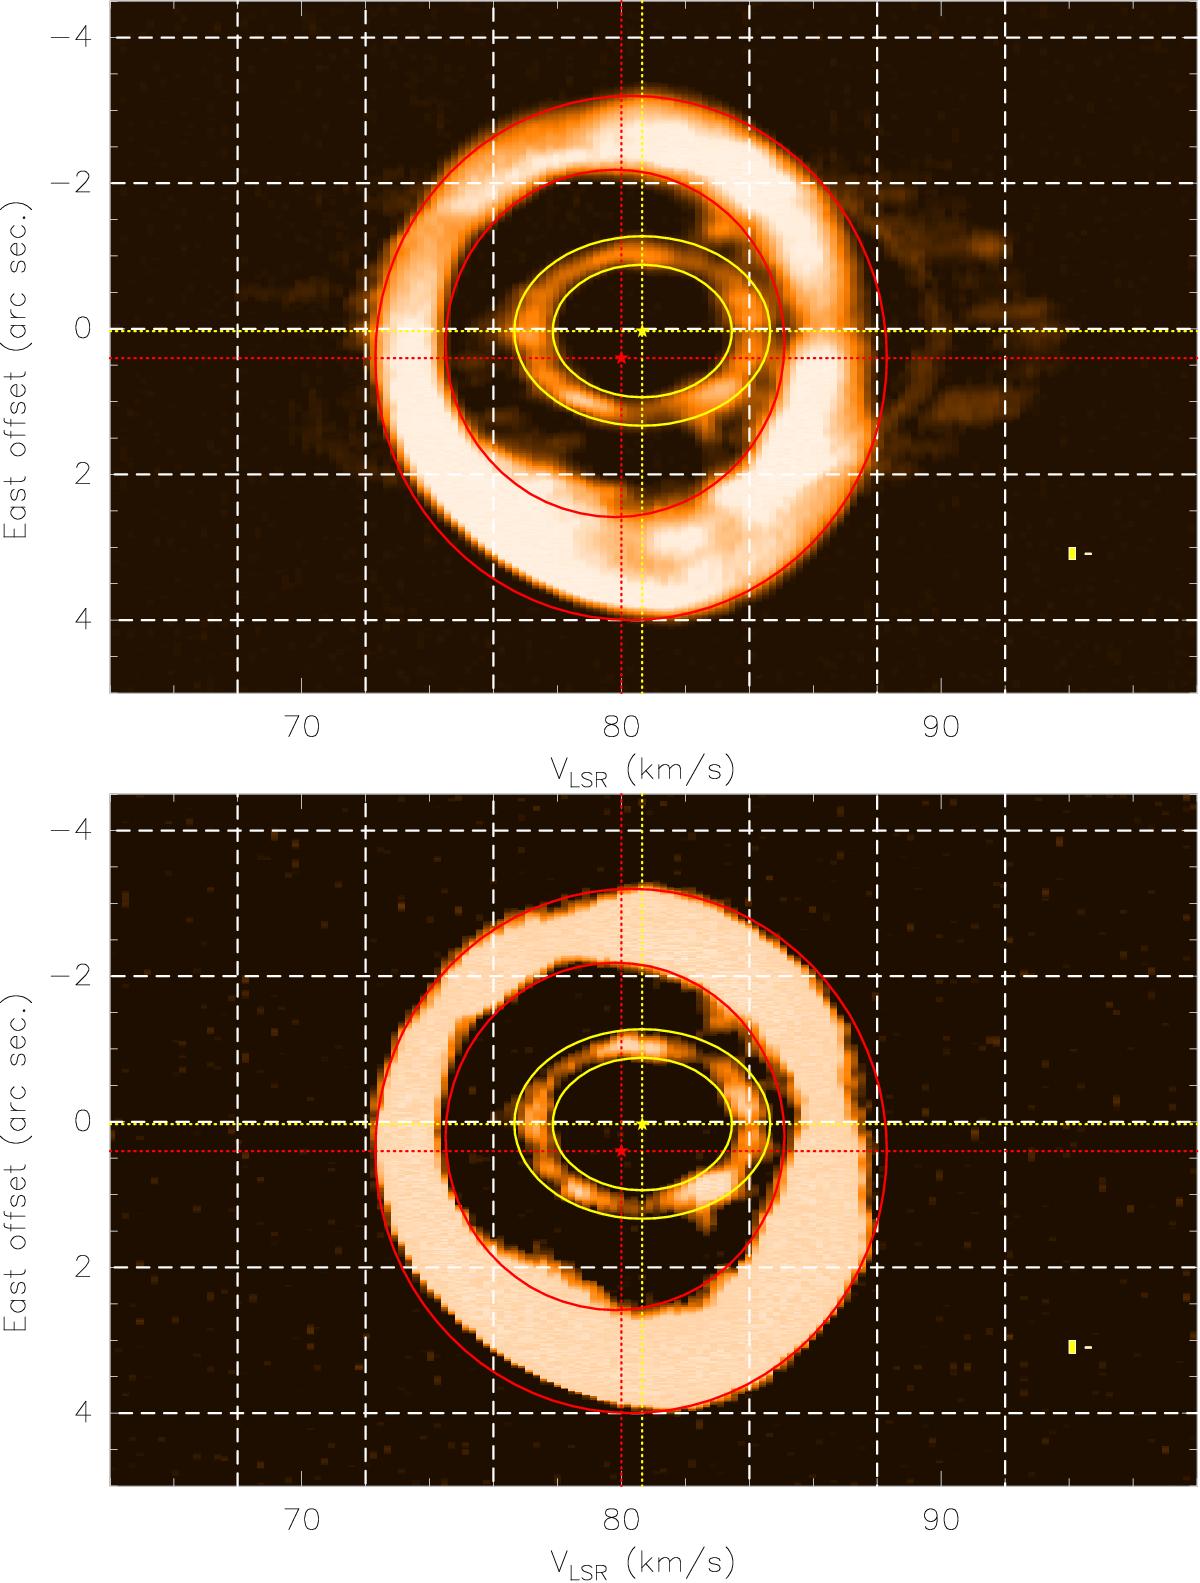
Addition of all position-velocity diagrams obtained along all the axes in the east-west direction. Above we show the result obtained for 12CO J = 3−2 emission, below the result for the 13CO line emission. (The color scale for 13CO is adapted to emphasize the weaker inner ring.) In the right bottom corner of both boxes two little rectangles are plotted to show spatial and spectral resolutions: along the Y-axis the larger rectangle (on the left) shows the beam size (0.17′′), the little rectangle (on the right) the pointing precision (0.01′′); along the X-axis their dimension correspond to the data spectral resolution (0.2 km s-1). See Sect. 6 for more details.
Current usage metrics show cumulative count of Article Views (full-text article views including HTML views, PDF and ePub downloads, according to the available data) and Abstracts Views on Vision4Press platform.
Data correspond to usage on the plateform after 2015. The current usage metrics is available 48-96 hours after online publication and is updated daily on week days.
Initial download of the metrics may take a while.