Fig. 8
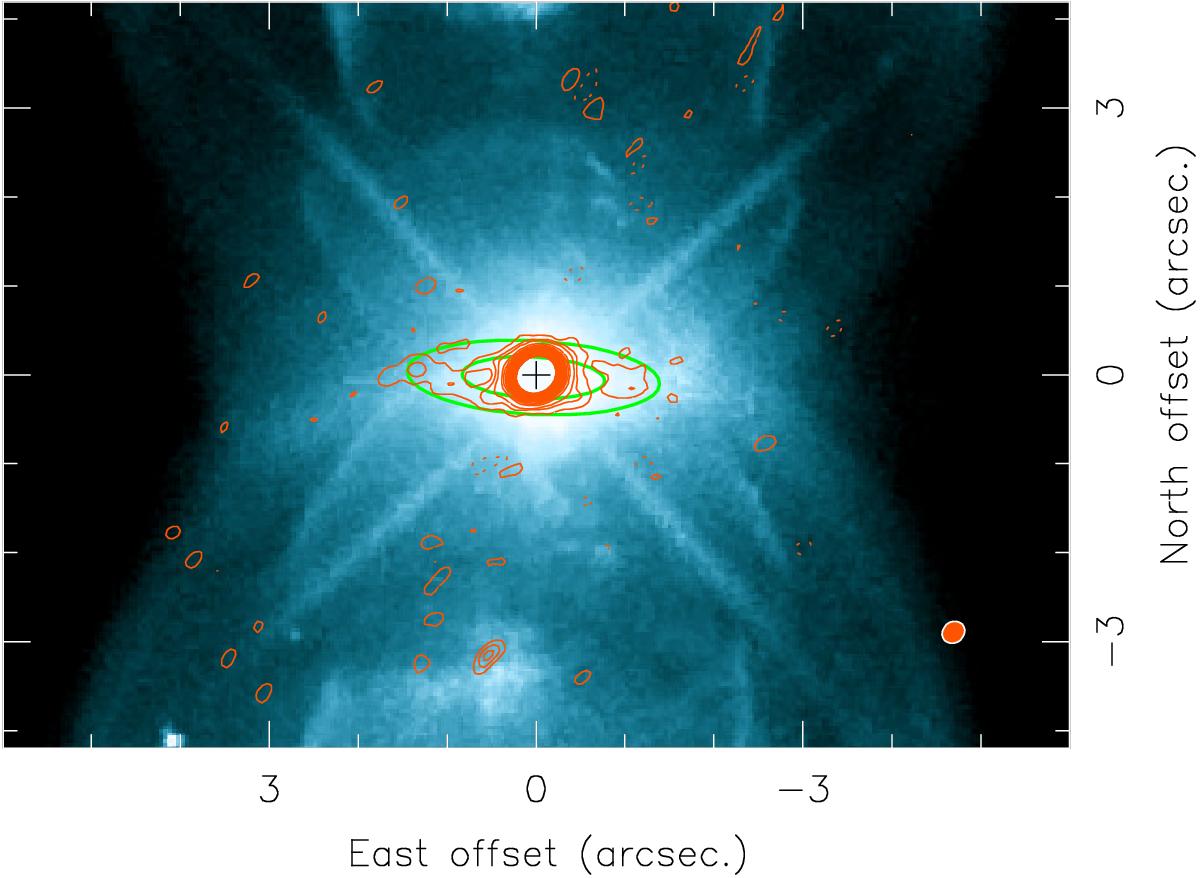
Continuum emission in contours overlaid on the optical HST image (Hubble Legacy Archive 2013) in M 2–9. Contours are shown at 4, 8, and 12σ and from then on with a spacing of 12σ (where the root-mean-square noise is 0.1 mJy beam-1) as a solid line and at −4σ as a dashed line. The synthesized beam is 0.̋27 × 0.̋23 with the major axis PA = 122° and is drawn in the bottom right corner of the last panel. The ellipses delimiting the rims of the inner ring in Fig. 3 are also plotted here, centered at [+0.̋03, −0.̋03] according to the analysis in Sect. 6.
Current usage metrics show cumulative count of Article Views (full-text article views including HTML views, PDF and ePub downloads, according to the available data) and Abstracts Views on Vision4Press platform.
Data correspond to usage on the plateform after 2015. The current usage metrics is available 48-96 hours after online publication and is updated daily on week days.
Initial download of the metrics may take a while.