Free Access
Fig. 7
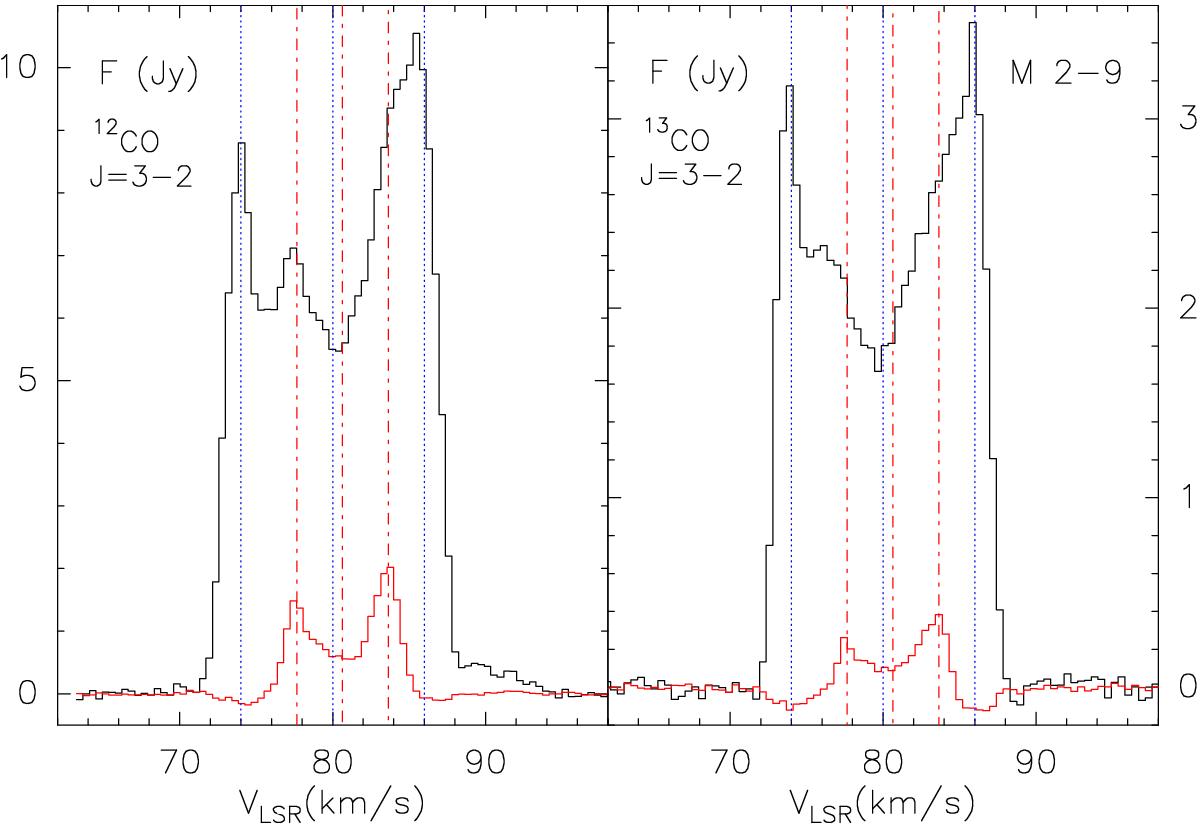
Total integrated 12CO and 13CO J = 3−2 emission in M 2–9 is shown in black, the emission integrated over the smaller ring is presented in red. Vertical red dotted lines are plotted at LSR velocities 80.65 (inner ring Vsys), 77.65, and 83.65 km s-1, and blue dotted lines at 80 (outer ring Vsys), 74, and 86 km s-1.
Current usage metrics show cumulative count of Article Views (full-text article views including HTML views, PDF and ePub downloads, according to the available data) and Abstracts Views on Vision4Press platform.
Data correspond to usage on the plateform after 2015. The current usage metrics is available 48-96 hours after online publication and is updated daily on week days.
Initial download of the metrics may take a while.