Fig. 6
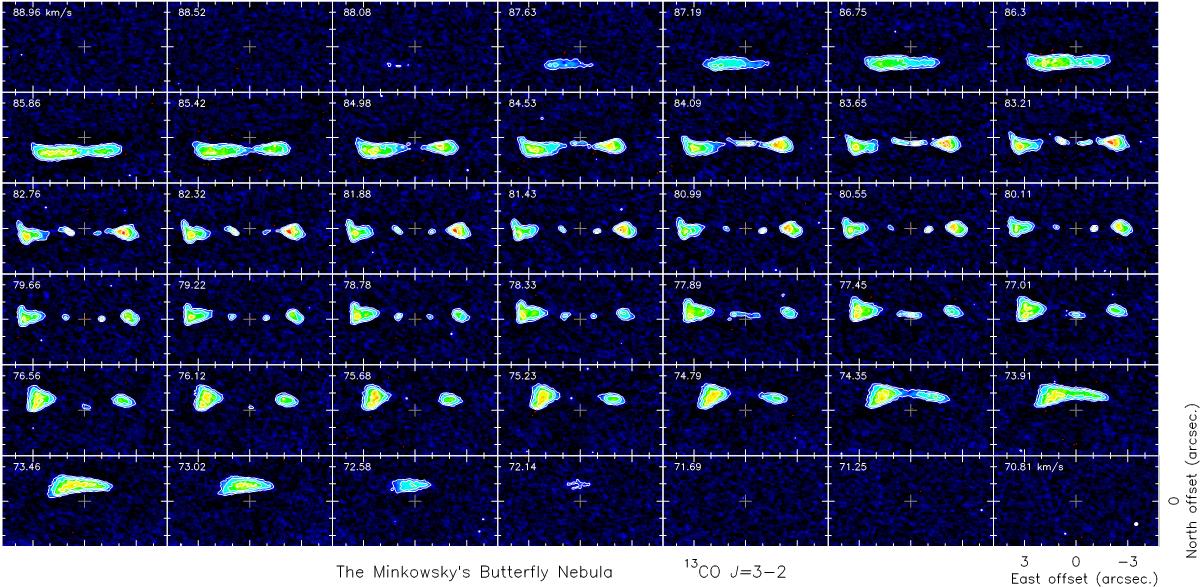
Channel maps of the 13CO J = 3−2 line emission toward M 2–9. The center is given by the position of the compact continuum emission, here subtracted, at J2000 coordinates RA = 17:05:37.966, Dec = −10:08:32.63. The LSR velocities are specified in the top left corner of each panel. Contours are shown in 4 ×σ with a spacing of 7 ×σ (where the root-mean-square noise is 2.5 mJy beam-1, which corresponds to 0.82 K in Rayleigh-Jeans-equivalent TMB units) as a white solid line, and at −4 ×σ as dashed red lines. The synthesized beam is 0.̋20 × 0.̋17 with the major axis PA = −79° and is drawn in the bottom right corner of the last panel.
Current usage metrics show cumulative count of Article Views (full-text article views including HTML views, PDF and ePub downloads, according to the available data) and Abstracts Views on Vision4Press platform.
Data correspond to usage on the plateform after 2015. The current usage metrics is available 48-96 hours after online publication and is updated daily on week days.
Initial download of the metrics may take a while.