Fig. 4
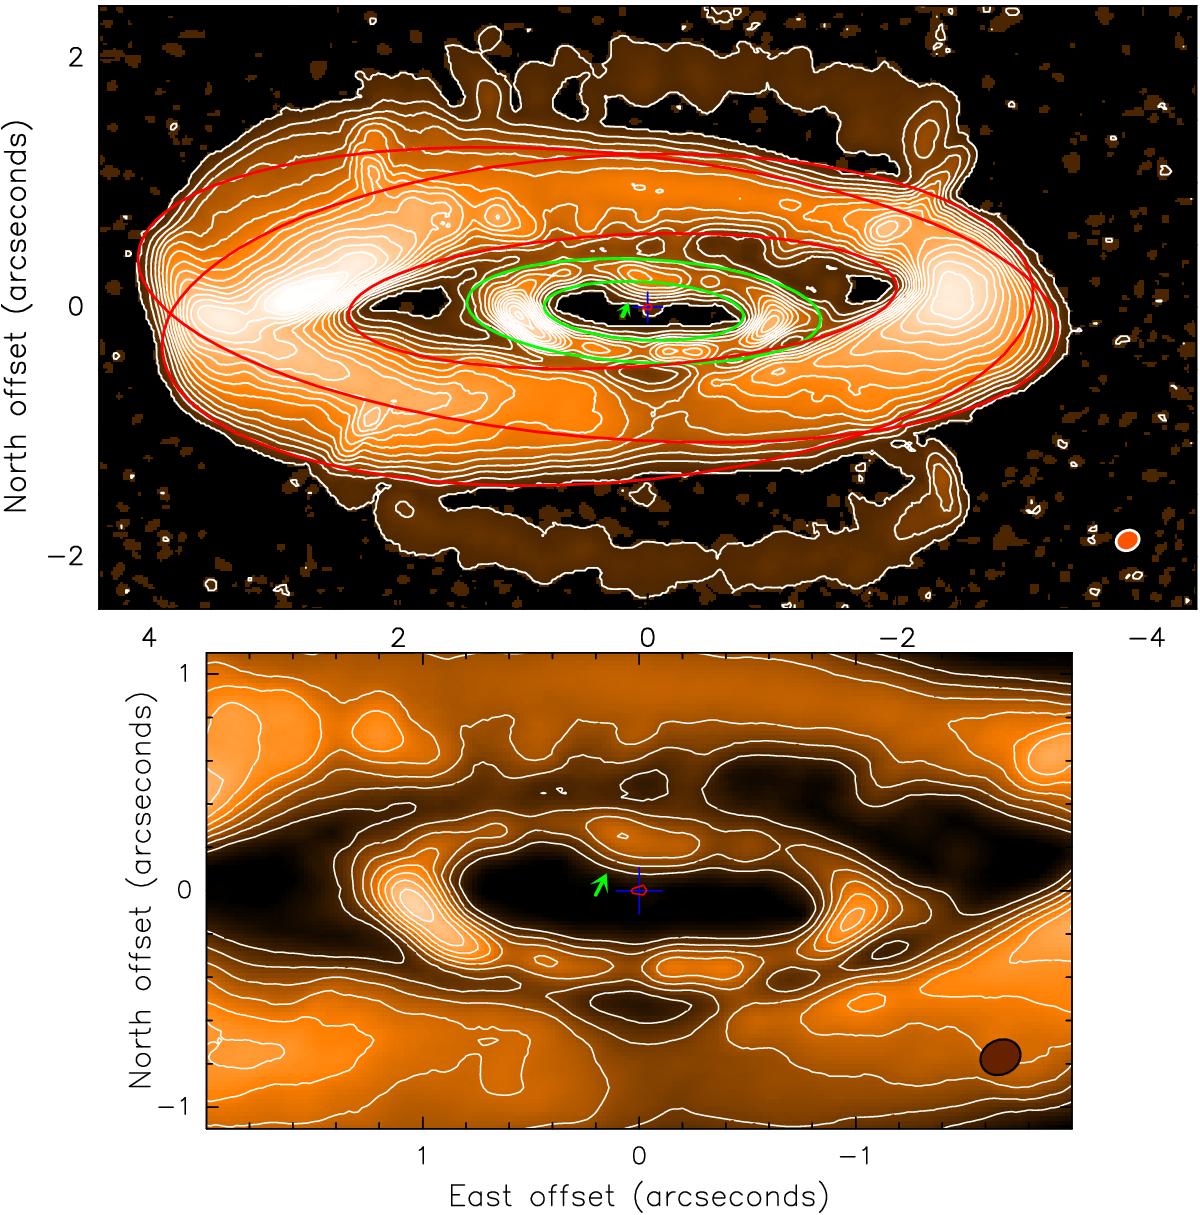
Velocity-integrated 12CO J = 3−2 line emission, similar to that shown in Fig. 3 left. At the center, the continuum peak emission is represented by a red contour, which probably traces the position of the stellar system (see Sect. 5). Above, the data are presented in a box of 8.8′′× 4.8′′ in size, and 4.0′′× 2.2′′ in the plot below. Ellipses are plotted to help visualize the departures from symmetry, and the synthesized beam is shown in the right bottom corner of both plots. More details in Sects. 3 and 6.
Current usage metrics show cumulative count of Article Views (full-text article views including HTML views, PDF and ePub downloads, according to the available data) and Abstracts Views on Vision4Press platform.
Data correspond to usage on the plateform after 2015. The current usage metrics is available 48-96 hours after online publication and is updated daily on week days.
Initial download of the metrics may take a while.