Fig. 3
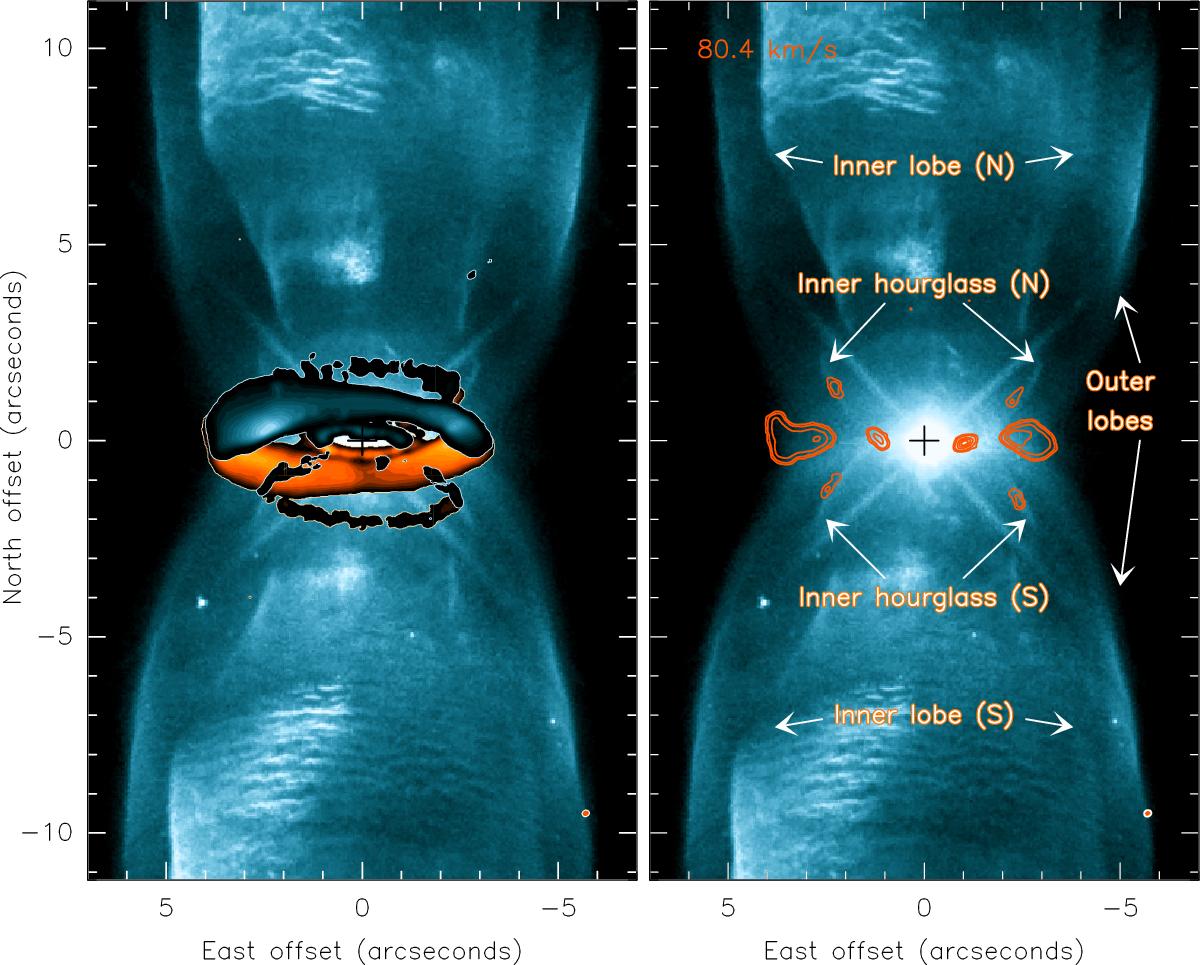
Left: velocity-integrated 12CO J = 2−1 line emission in color scale (blue scale for the 68–80.3 km s-1 spectral range and orange for the 80.3–94 km s-1 interval) superimposed on the optical image obtained with the Hubble Space Telescope (Hubble Legacy Archive 2013). More details can be found in Sect. 3 and Fig. 1. Right: brightness 12CO J = 3−2 emission at the central velocity (LSR velocity 80.4 km s-1, after integrating in 0.4 km s-1) in contours overlaid on the optical image in color scale. Contours are plotted at 4 ×σ, and from 10 ×σ every 10 ×σ. The synthesized beam is shown in the right bottom corner of both plots. Labels are given to each of the main components identified in the optical image, which are discussed in Sect. 8.
Current usage metrics show cumulative count of Article Views (full-text article views including HTML views, PDF and ePub downloads, according to the available data) and Abstracts Views on Vision4Press platform.
Data correspond to usage on the plateform after 2015. The current usage metrics is available 48-96 hours after online publication and is updated daily on week days.
Initial download of the metrics may take a while.