Fig. 12
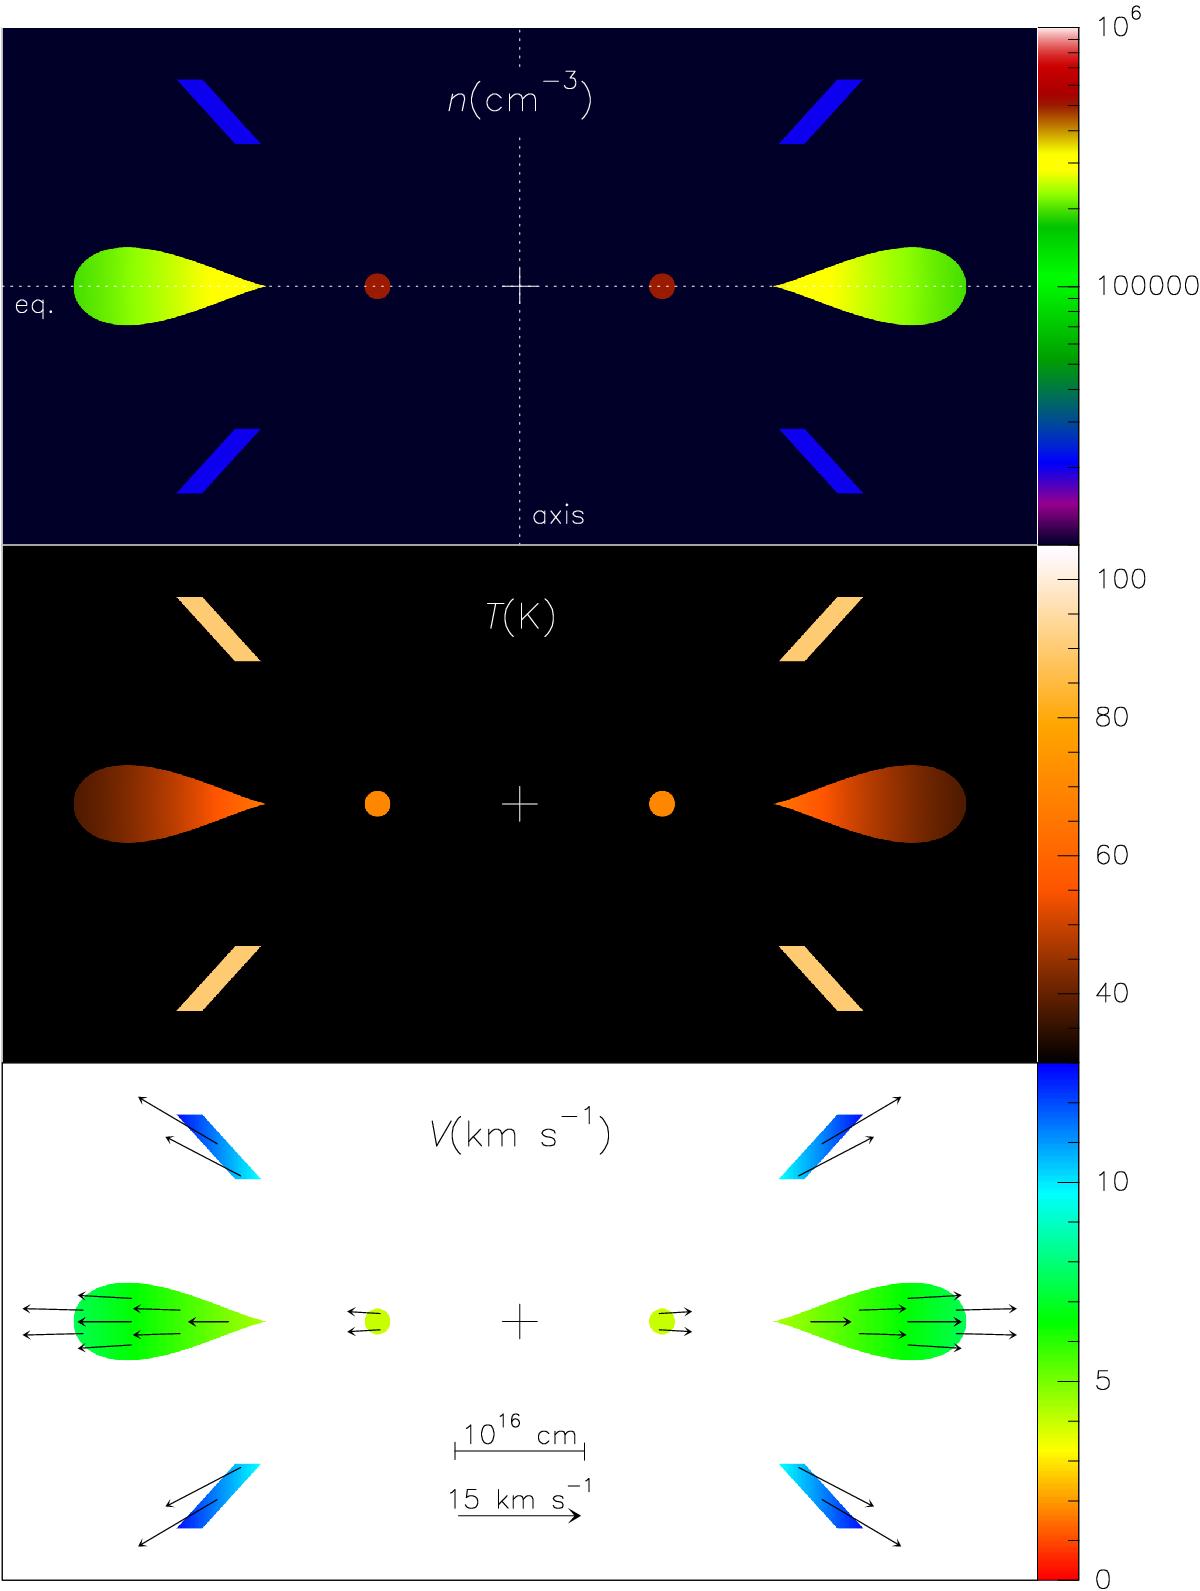
Model used to obtain the predictions of the 12CO J = 3−2 emission presented in Fig. 11, and with which we can also reproduce the data obtained for 13CO. The sketch of the model nebula shows the CO-rich gas distribution in a plane containing the axis of symmetry and perpendicular to the equatorial plane; we recall that axial symmetry is assumed. The axis and the equator correspond in our drawings to the vertical and horizontal axes that intersect at the nebula center, i.e., at the small cross drawn in the center of the panels. The three main components of our model can be identified: the inner equatorial torus (with the highest density), the outer more extended ring, and the crown-shaped structure (with the lowest density and well outside the equatorial plane). At the top, the particle density (cm-3) is represented in color scale. In the middle panel, we show the kinetic temperatures (K); note the relatively high temperatures in the crown. The velocity field is shown at the bottom (km s-1, see the modulus in color scale and some velocity vectors). More details can be found in Sect. 7.
Current usage metrics show cumulative count of Article Views (full-text article views including HTML views, PDF and ePub downloads, according to the available data) and Abstracts Views on Vision4Press platform.
Data correspond to usage on the plateform after 2015. The current usage metrics is available 48-96 hours after online publication and is updated daily on week days.
Initial download of the metrics may take a while.