Fig. 10
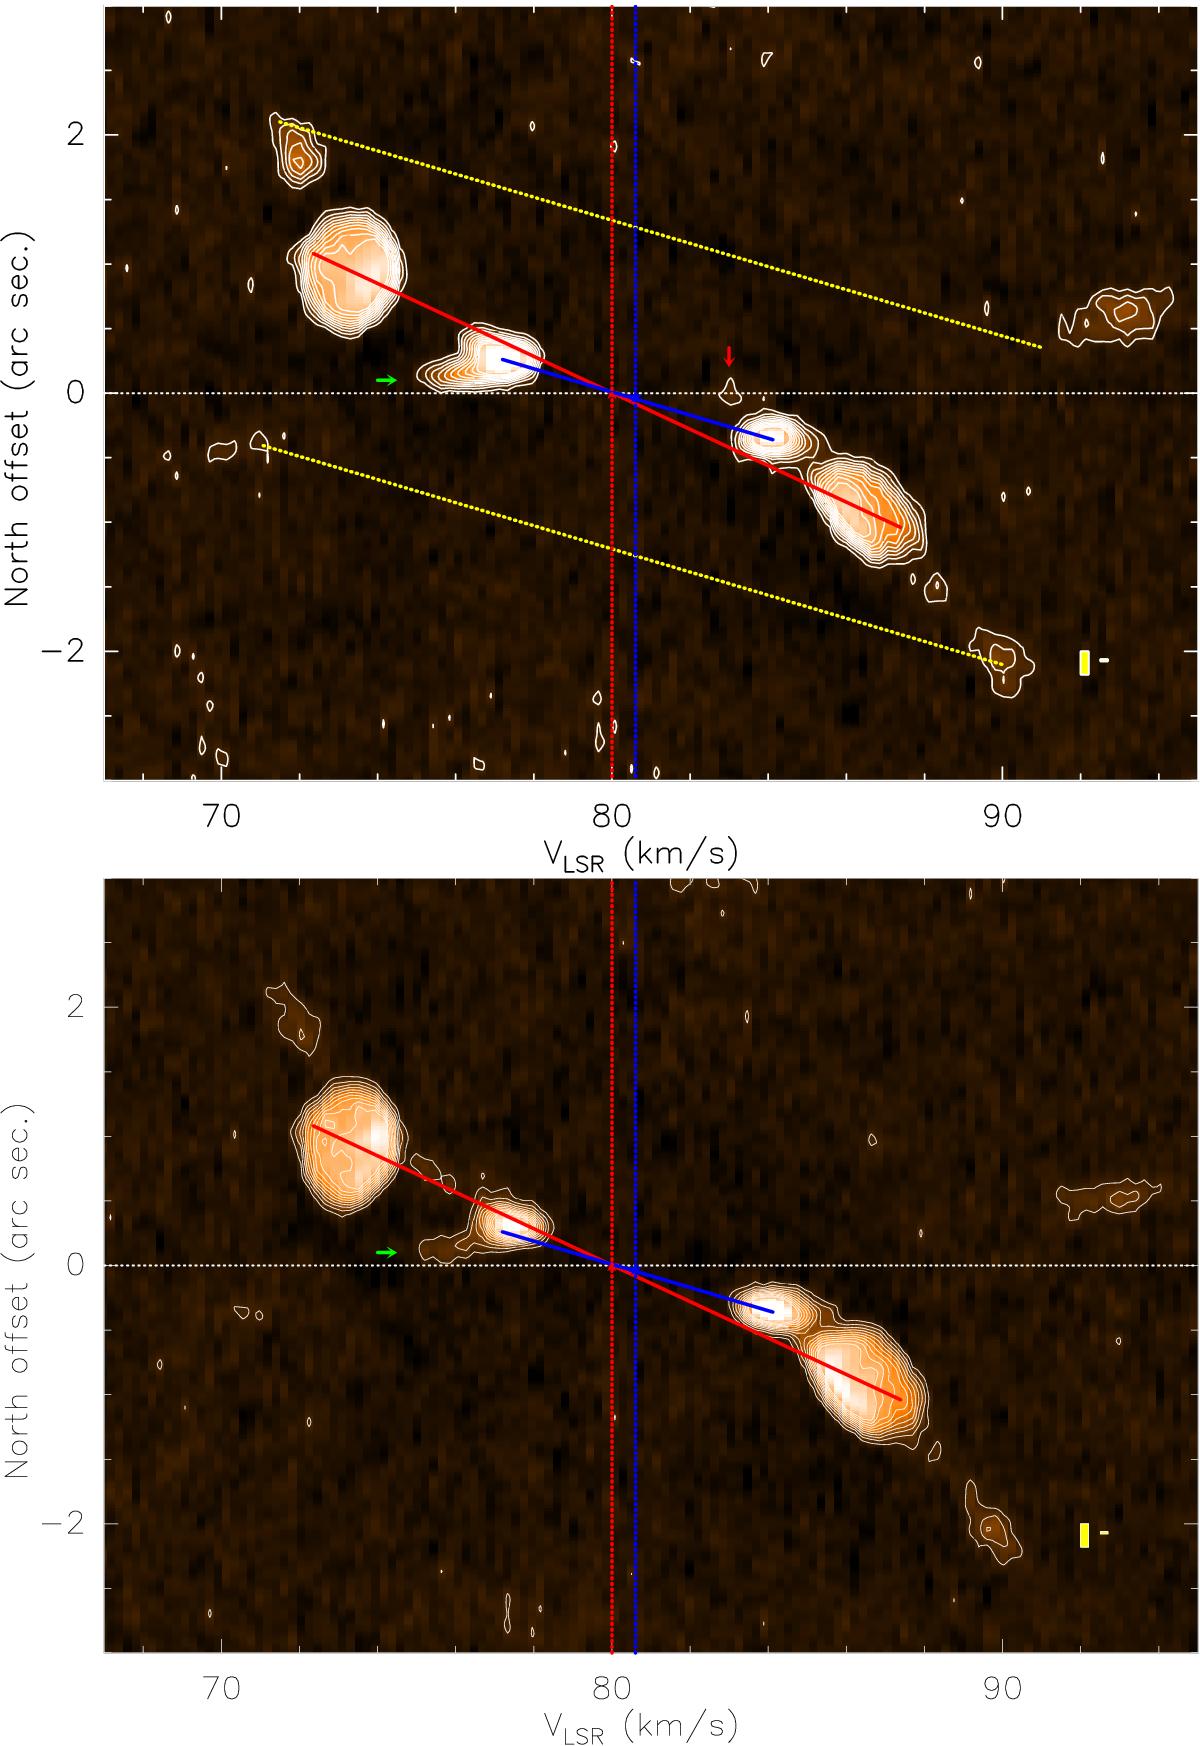
Position-velocity diagrams obtained along two nearby north-south axes for the 12CO J = 3−2 line emission. In the plot above, the axis crossed the center of the innermost ring (0.03′′ eastward), in the one below the center of the outermost ring (i.e., 0.3′′ eastward). In the right bottom corner of both boxes we plot two small rectangles to show the resolutions, similar to those in Fig. 9. Colored solid lines are plotted to show the different position-velocity gradients. More details can be found in Sect. 6.
Current usage metrics show cumulative count of Article Views (full-text article views including HTML views, PDF and ePub downloads, according to the available data) and Abstracts Views on Vision4Press platform.
Data correspond to usage on the plateform after 2015. The current usage metrics is available 48-96 hours after online publication and is updated daily on week days.
Initial download of the metrics may take a while.