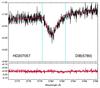
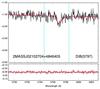
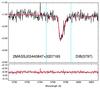
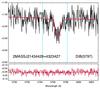
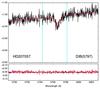
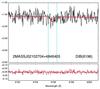
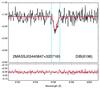
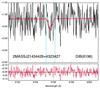
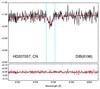
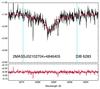
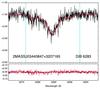
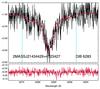
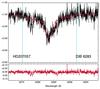
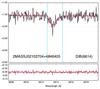
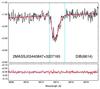
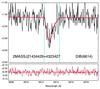
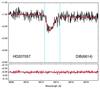
Fig. 8
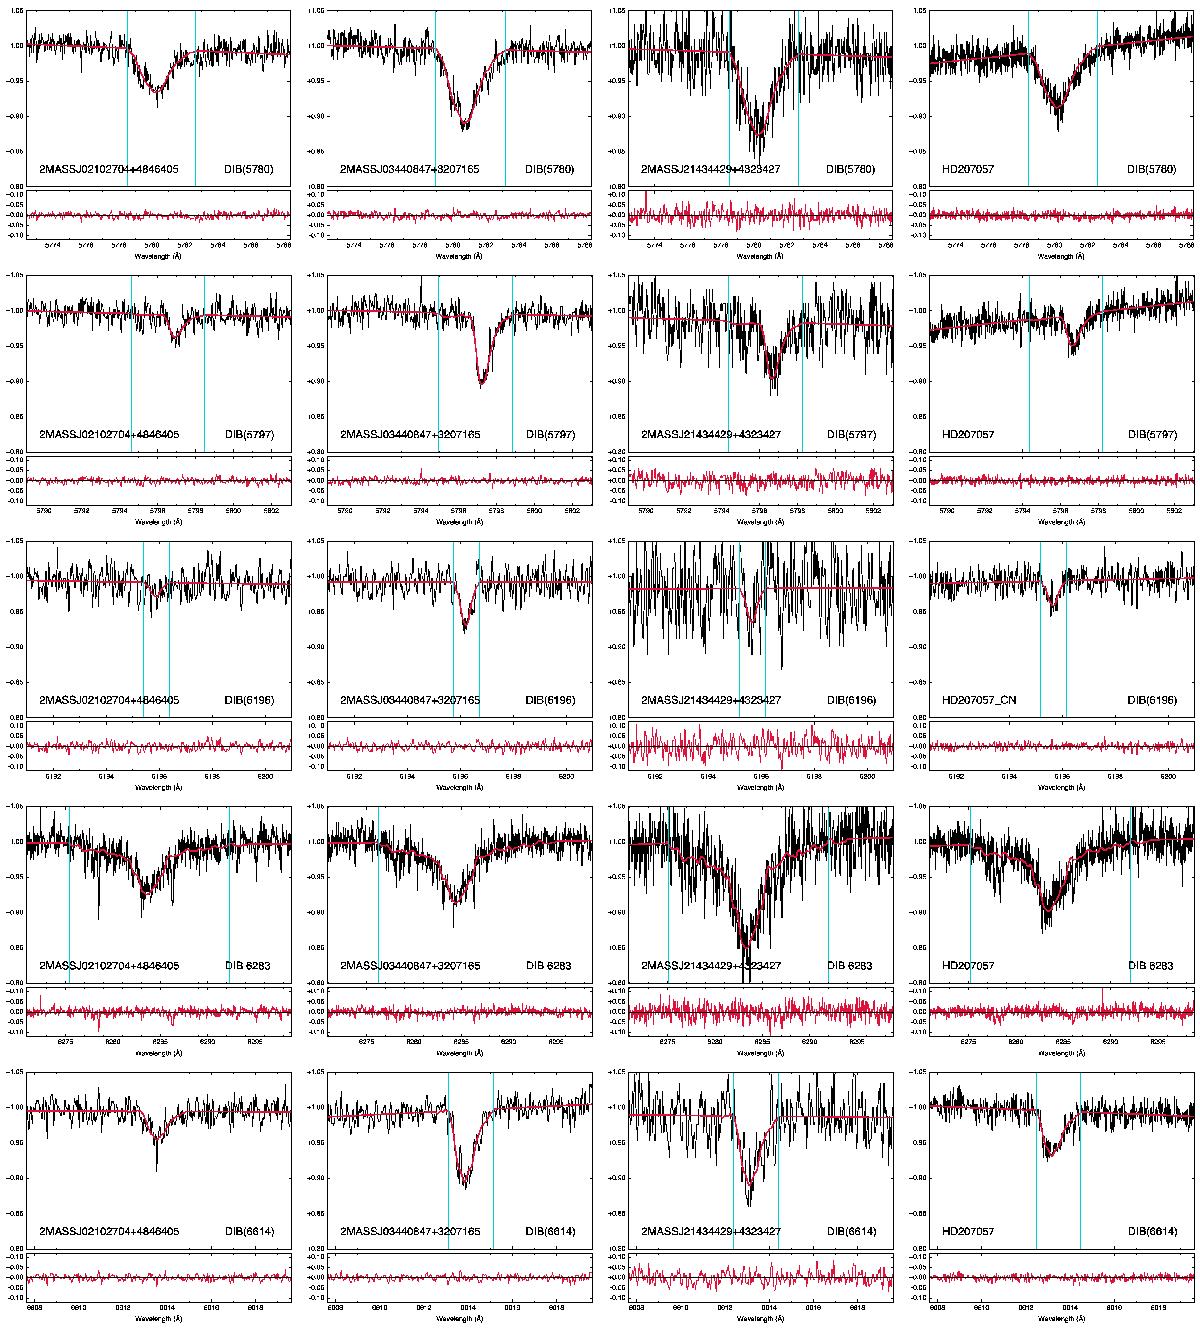
Representative fit examples for the optical DIBs for three stars observed with NARVAL (Cols. 1–3) and one star observed with SOPHIE (last column). They are ordered from bluer (top) to redder (bottom) band. Each panel contains a main graphic on top, with the observed spectrum in black and the fit in red. Integration limits for estimating the equivalent width are marked in cyan. The auxiliary graphic at the bottom contains the residuals in red.
Current usage metrics show cumulative count of Article Views (full-text article views including HTML views, PDF and ePub downloads, according to the available data) and Abstracts Views on Vision4Press platform.
Data correspond to usage on the plateform after 2015. The current usage metrics is available 48-96 hours after online publication and is updated daily on week days.
Initial download of the metrics may take a while.