Free Access
Fig. 7
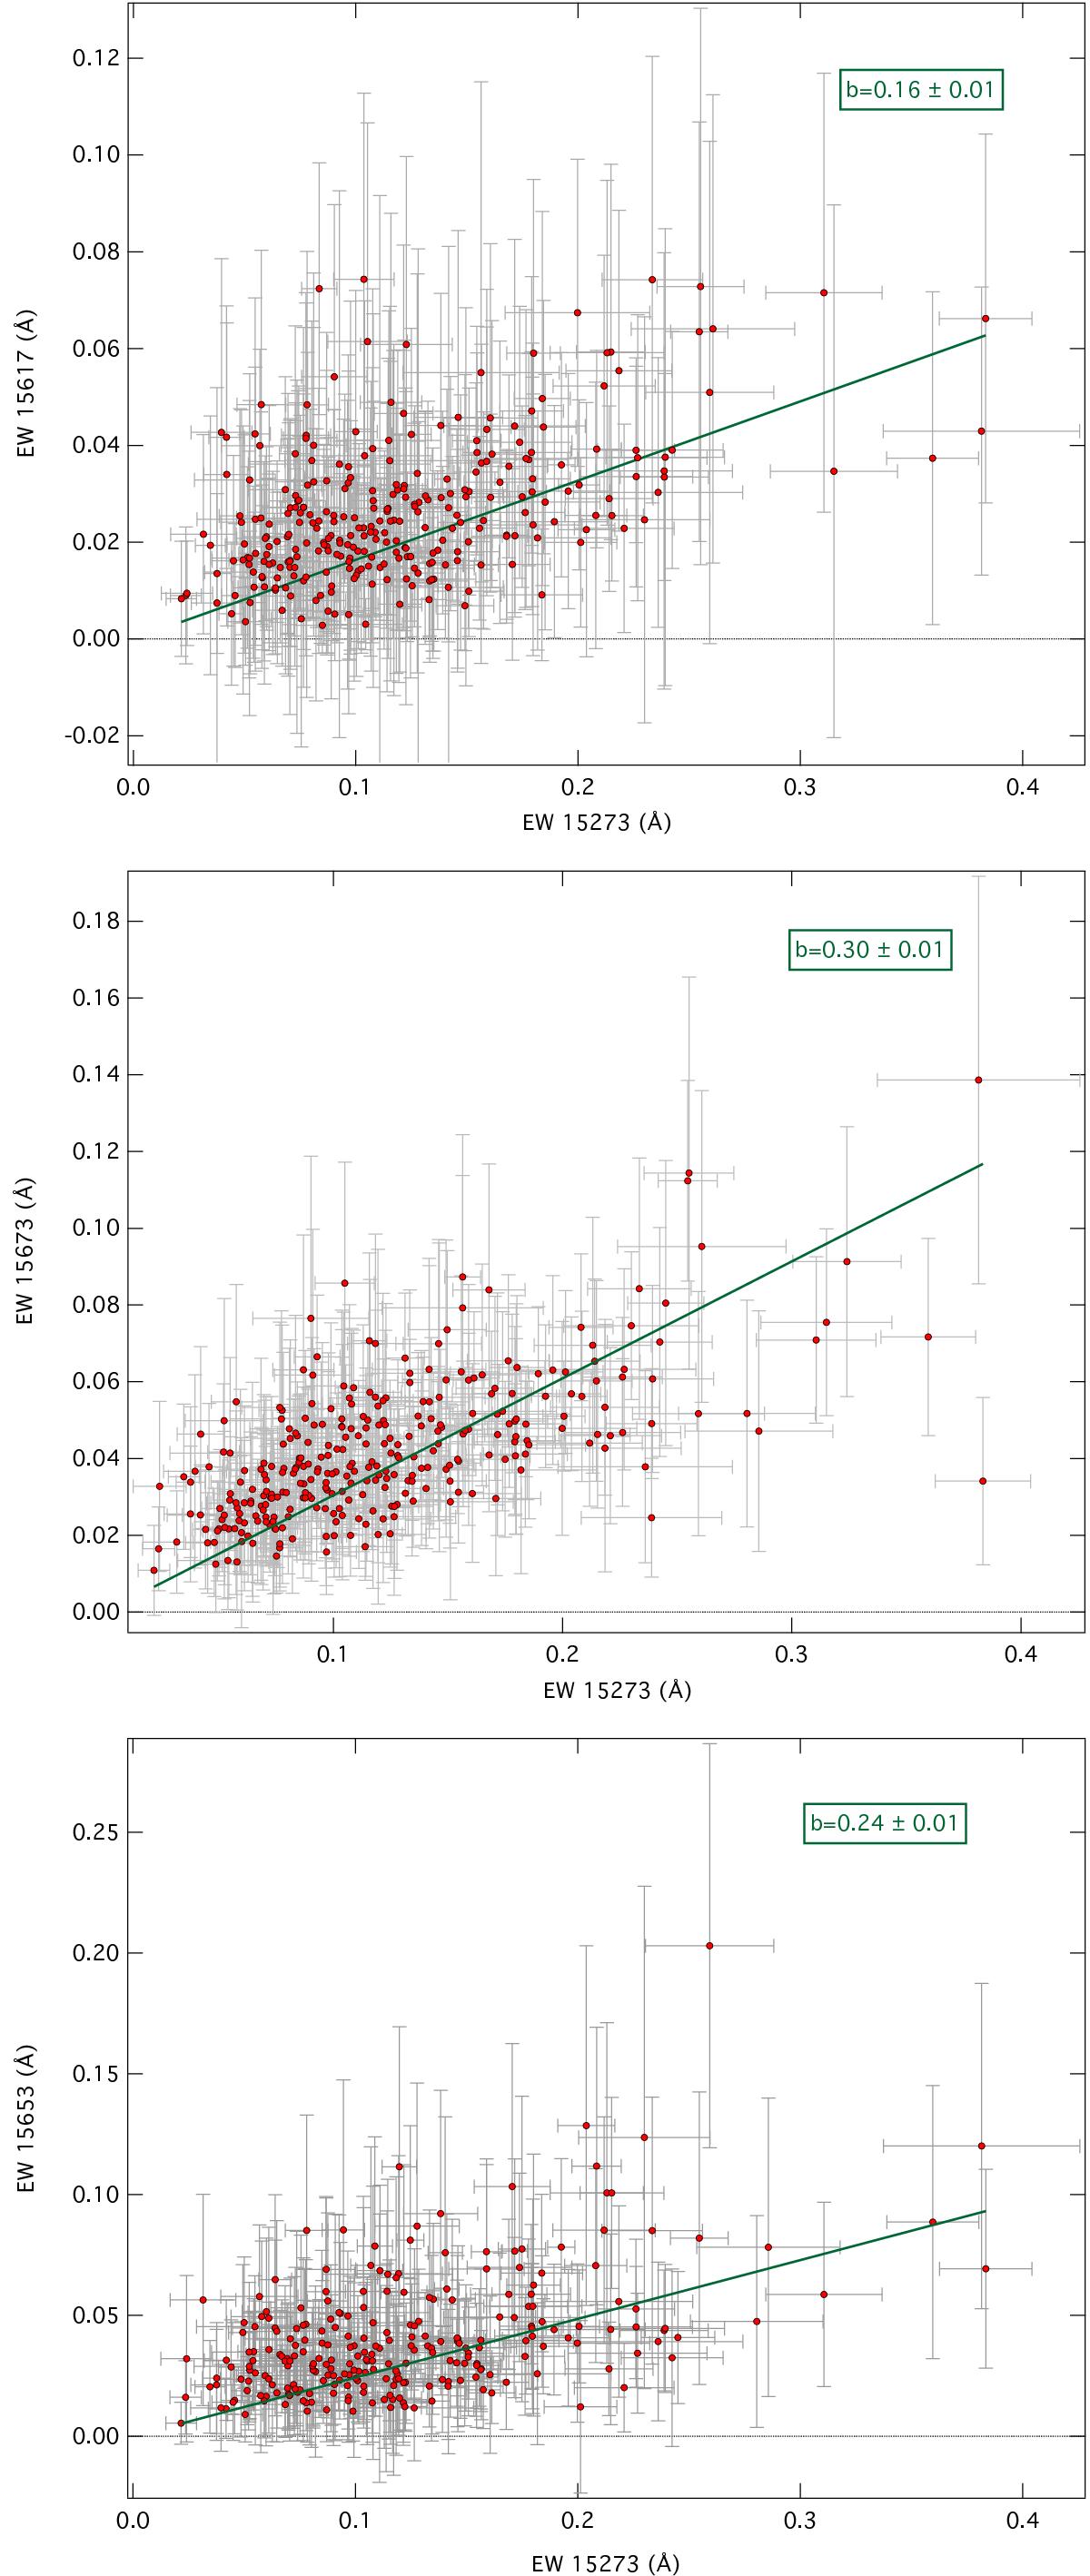
Correlation between the λλ15617, 15 673, and 15 653 NIR DIBs and the strong λ15273 NIR DIB. The slope for the ODR proportional linear fit is shown in each plot.
This figure is made of several images, please see below:
Current usage metrics show cumulative count of Article Views (full-text article views including HTML views, PDF and ePub downloads, according to the available data) and Abstracts Views on Vision4Press platform.
Data correspond to usage on the plateform after 2015. The current usage metrics is available 48-96 hours after online publication and is updated daily on week days.
Initial download of the metrics may take a while.