Free Access
Fig. 6
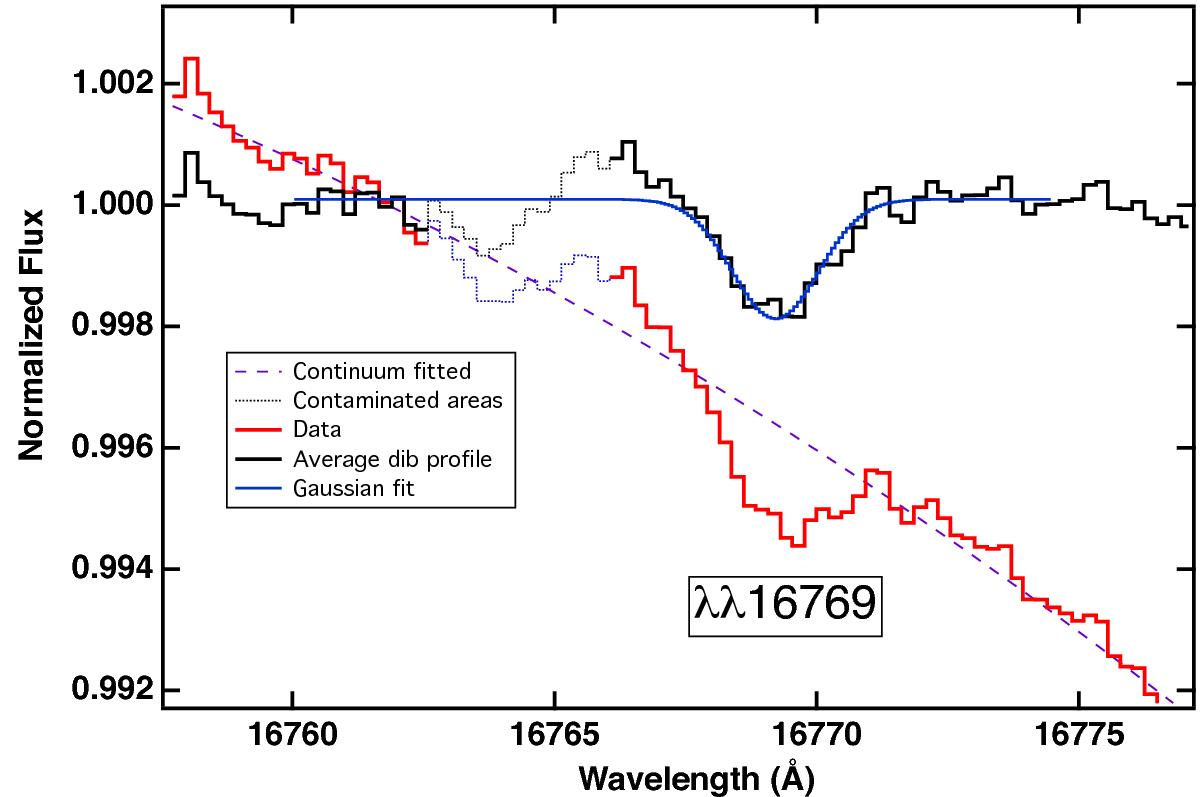
Potential λ16769 DIB candidate. In red is shown the original stacked spectrum. The dashed line is the fitted continuum around the DIB, and the normalized spectrum is shown in black. A spectral interval strongly contaminated by a telluric line and not included in the continuum fitting is shown in pale blue.
Current usage metrics show cumulative count of Article Views (full-text article views including HTML views, PDF and ePub downloads, according to the available data) and Abstracts Views on Vision4Press platform.
Data correspond to usage on the plateform after 2015. The current usage metrics is available 48-96 hours after online publication and is updated daily on week days.
Initial download of the metrics may take a while.