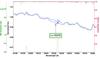
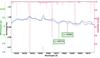
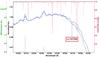
Fig. 4
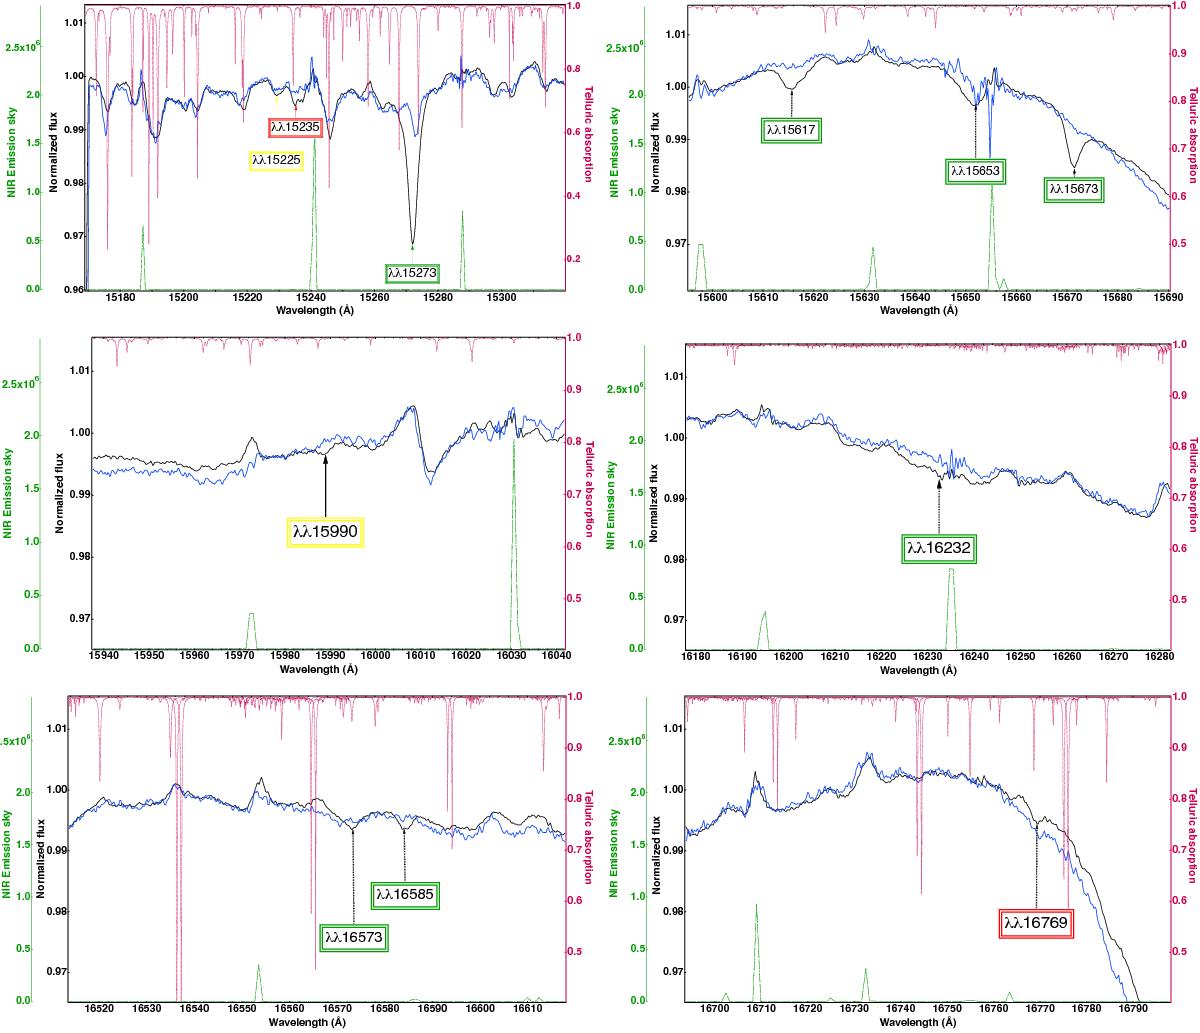
Stacked spectra created from 164 sight lines selected for their strong, well detected λ15273 DIB (solid black curve), and for 40 sightlines selected for a combination of high signal, clean spectrum, and weakness of the λ15273 DIB (blue solid curve). Before stacking, the spectra have been shifted to a common rest frame. In each figure the pink dashed lines show the telluric models and the green dashed curve displays the NIR emission sky. At the location of an actual DIB we expect the black curve to exhibit a depression by comparison with the blue curve. Telluric absorption and emission spectra allow us to distinguish artifacts that are due to telluric lines and real interstellar absorptions. Weak NIR DIBs detected previously are indicated by colored boxes with the following code: green box: detected by Geballe et al. (2011) and confirmed by Cox et al. (2014); yellow box: detected by Geballe et al. (2011), but not confirmed by Cox et al. (2014); red box: potential new detection.
Current usage metrics show cumulative count of Article Views (full-text article views including HTML views, PDF and ePub downloads, according to the available data) and Abstracts Views on Vision4Press platform.
Data correspond to usage on the plateform after 2015. The current usage metrics is available 48-96 hours after online publication and is updated daily on week days.
Initial download of the metrics may take a while.