Fig. 3
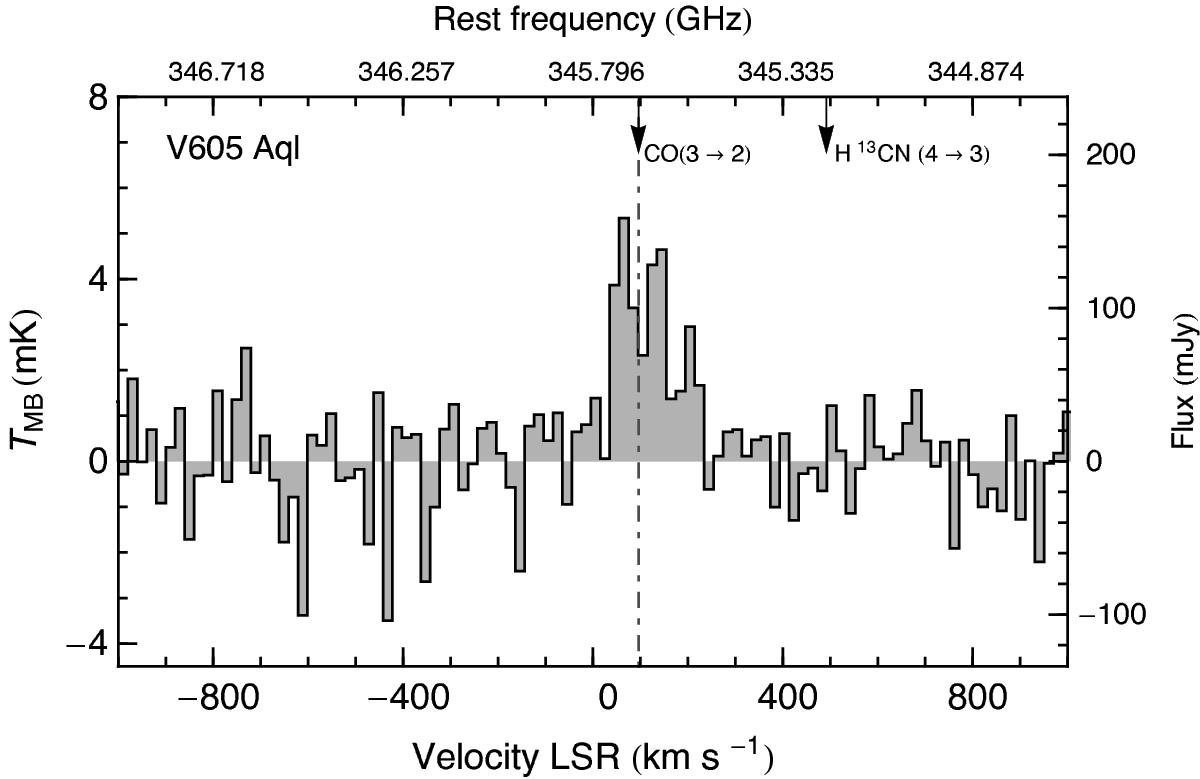
APEX spectrum of the CO (J = 3 → 2) emission in V605 Aql. The width of each channel is 20 km s-1. The dotted vertical line corresponds to the systemic velocity relative to the local standard of rest of the PN A58, vsys = 96 km s-1, estimated by Clayton et al. (2013). The arrows indicate the rest frequencies for the CO (J = 3 → 2) and H13CN (J = 4 → 3) lines. The flux density in the right axis was calculated using the corresponding value of Γ, shown in Table 1.
Current usage metrics show cumulative count of Article Views (full-text article views including HTML views, PDF and ePub downloads, according to the available data) and Abstracts Views on Vision4Press platform.
Data correspond to usage on the plateform after 2015. The current usage metrics is available 48-96 hours after online publication and is updated daily on week days.
Initial download of the metrics may take a while.