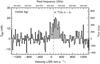
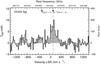
Fig. 1

V4334 Sgr spectra of the emission line detected with APEX. The width of the channels is 20 km s-1 and the dotted vertical line corresponds to the systemic velocity of the source, vsys = 125 km s-1 (Duerbeck et al. 1997). The flux density in the right axis was calculated using the corresponding value of Γ shown in Table 1. Top: spectrum of the HCN (J = 4 → 3) emission. Bottom: spectrum of the H13CN (J = 4 → 3) emission. The arrows in the upper axis indicate the rest frequencies for the CO (J = 3 → 2) and H13CN (J = 4 → 3) lines.
Current usage metrics show cumulative count of Article Views (full-text article views including HTML views, PDF and ePub downloads, according to the available data) and Abstracts Views on Vision4Press platform.
Data correspond to usage on the plateform after 2015. The current usage metrics is available 48-96 hours after online publication and is updated daily on week days.
Initial download of the metrics may take a while.