Fig. 4
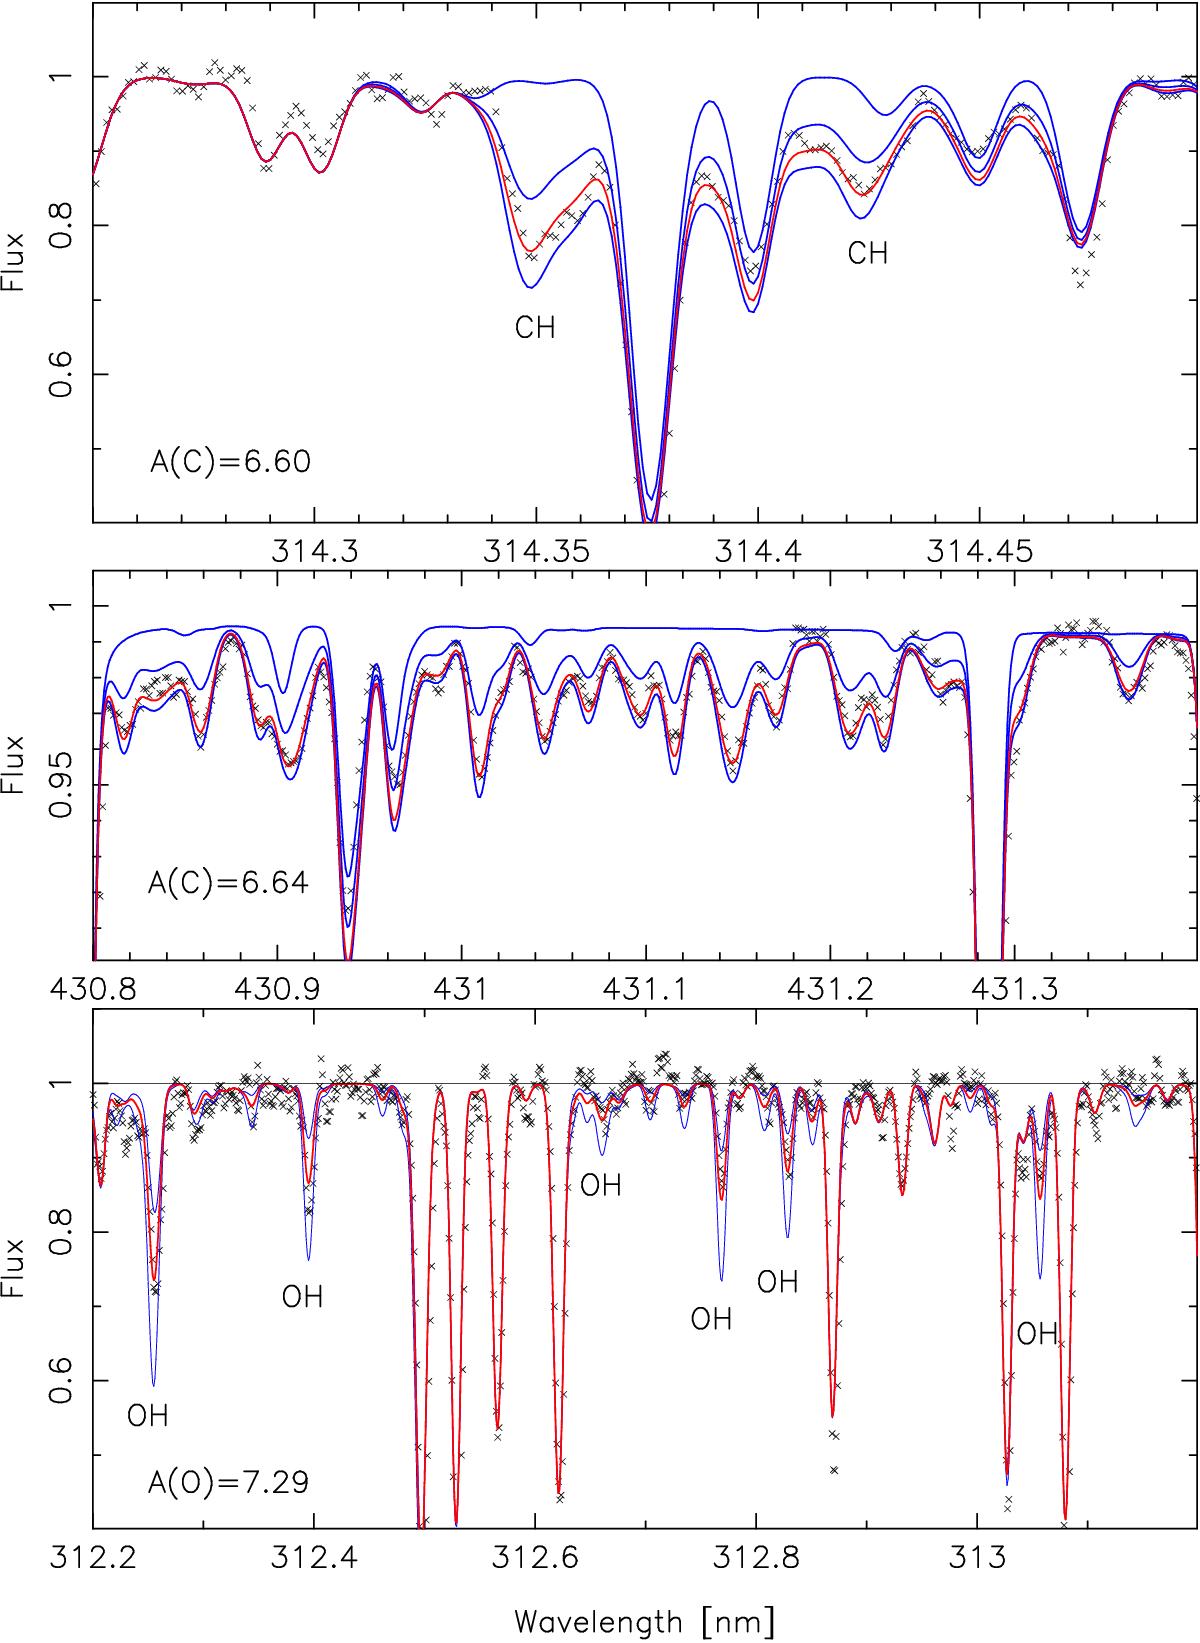
Observed profile of the CH and OH bands in HD 84937. For the CH bands the 1D ETL synthetic profiles (blue thin lines) have been computed with A(C) = 0.0, 6.4, and 6.7. The absorption by the wing of Hγ has been included in the computation of the G-band. The thick red line represents the best fit: A(C) = 6.60 for the UV CH feature and A(C) = 6.64 for the G-band. The synthetic profile of the OH band has been computed with A(O) = 7.0 and 7.6. The best fit is obtained with A(O) = 7.29
Current usage metrics show cumulative count of Article Views (full-text article views including HTML views, PDF and ePub downloads, according to the available data) and Abstracts Views on Vision4Press platform.
Data correspond to usage on the plateform after 2015. The current usage metrics is available 48-96 hours after online publication and is updated daily on week days.
Initial download of the metrics may take a while.