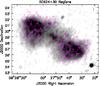
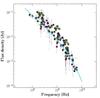
Fig. 8
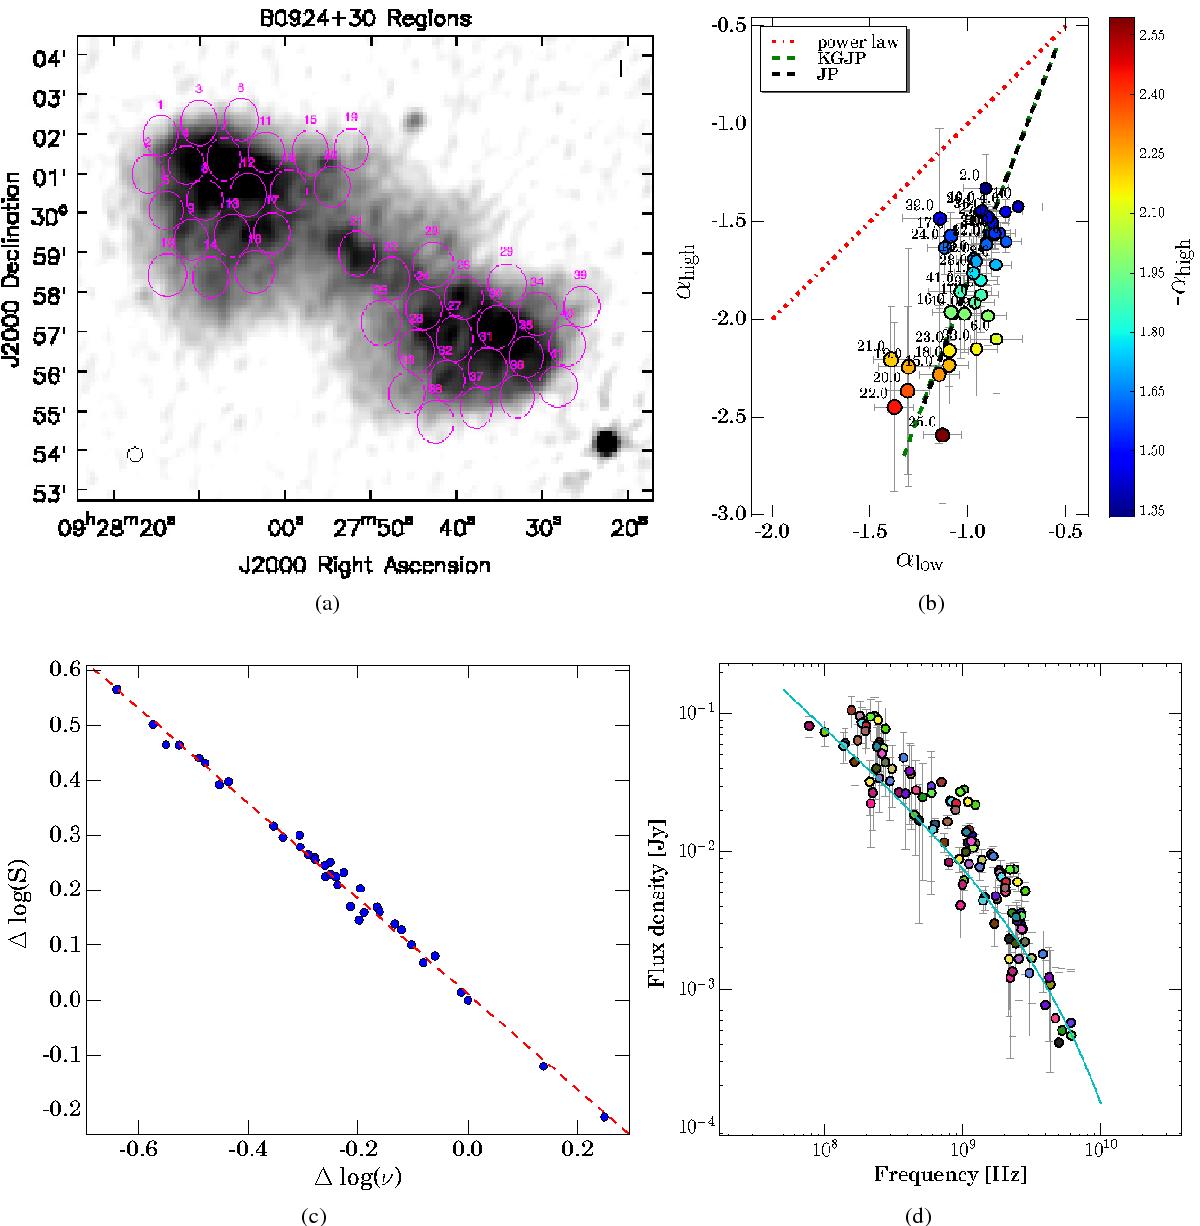
Top left: measurement regions overlaid on a LOFAR gray-scale map of the source. Top right: colour–colour plot. The colour of the plotted points indicates their high spectral index value, while their size is proportional to their low spectral index value. Here, ![]() and
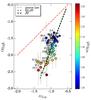
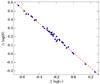
and ![]() . Bottom left: shift plot. The slope of the fit is −0.87 ± 0.01. Bottom right: total set of shifted data and a (JP) model fit for all of the regions. Data points belonging to a given region share the same colour.
. Bottom left: shift plot. The slope of the fit is −0.87 ± 0.01. Bottom right: total set of shifted data and a (JP) model fit for all of the regions. Data points belonging to a given region share the same colour.
Current usage metrics show cumulative count of Article Views (full-text article views including HTML views, PDF and ePub downloads, according to the available data) and Abstracts Views on Vision4Press platform.
Data correspond to usage on the plateform after 2015. The current usage metrics is available 48-96 hours after online publication and is updated daily on week days.
Initial download of the metrics may take a while.