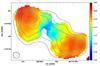
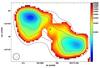
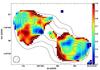
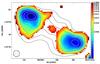
Fig. 5
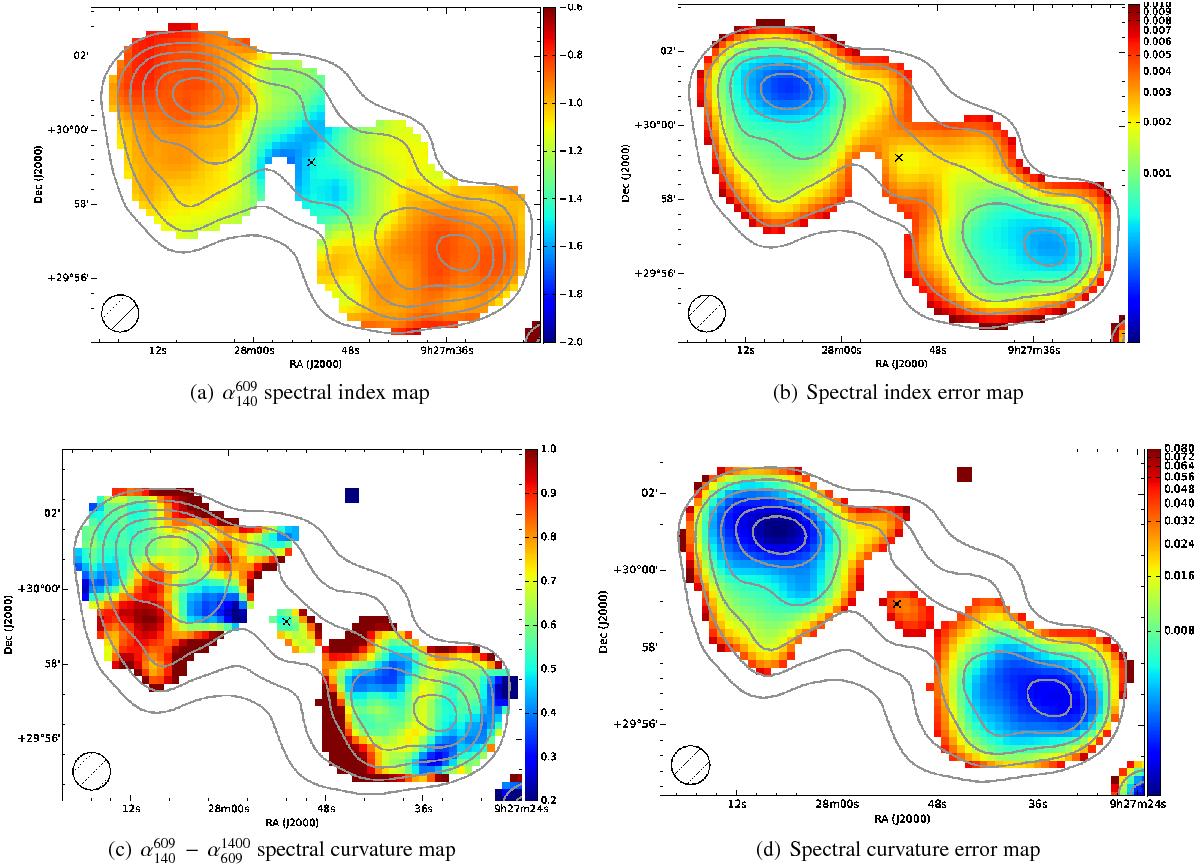
Spectral index and spectral curvature maps for pixels with surface brightness greater than 7σ and 3σ, respectively, in all of the input maps. We used the averaged low-resolution LOFAR image (Table 2). Overlaid are LOFAR contour levels spanning the interval between −10σ and 60σ, with a step of 10σ, where σ = 4 mJy beam-1. The black cross indicates the position of the host galaxy.
Current usage metrics show cumulative count of Article Views (full-text article views including HTML views, PDF and ePub downloads, according to the available data) and Abstracts Views on Vision4Press platform.
Data correspond to usage on the plateform after 2015. The current usage metrics is available 48-96 hours after online publication and is updated daily on week days.
Initial download of the metrics may take a while.