Fig. 6
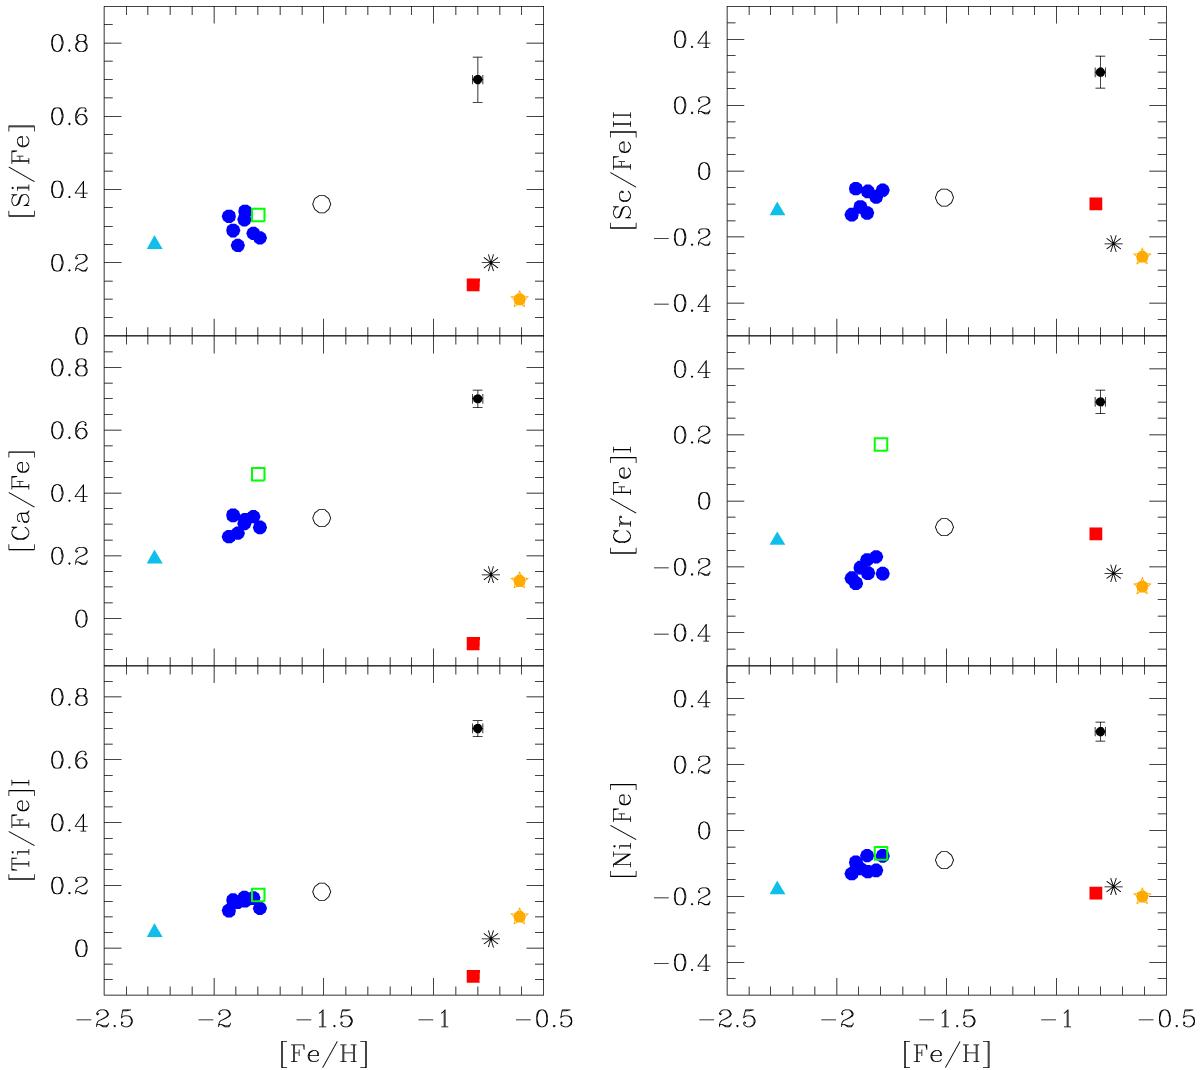
Abundance ratios of α- and iron-peak elements derived from UVES spectra in NGC 5634 as a function of the metallicity (filled blue circles). Also plotted are the average values from Table 11 of Carretta et al. (2014a) relative to the Sgr nucleus (black asterisk, Carretta et al. 2010b), to M 54 (black empty circle, Carretta et al. 2010b), to Pal 12 (red filled square, Cohen 2004), to Terzan 7 (orange filled star, Sbordone et al. 2007), to Terzan 8 (filled light-blue triangle, Carretta et al. 2014a) and to Arp 2 (green empty square, Mottini et al. 2008). Internal error bars refer to our UVES sample.
Current usage metrics show cumulative count of Article Views (full-text article views including HTML views, PDF and ePub downloads, according to the available data) and Abstracts Views on Vision4Press platform.
Data correspond to usage on the plateform after 2015. The current usage metrics is available 48-96 hours after online publication and is updated daily on week days.
Initial download of the metrics may take a while.