Free Access
Fig. 5
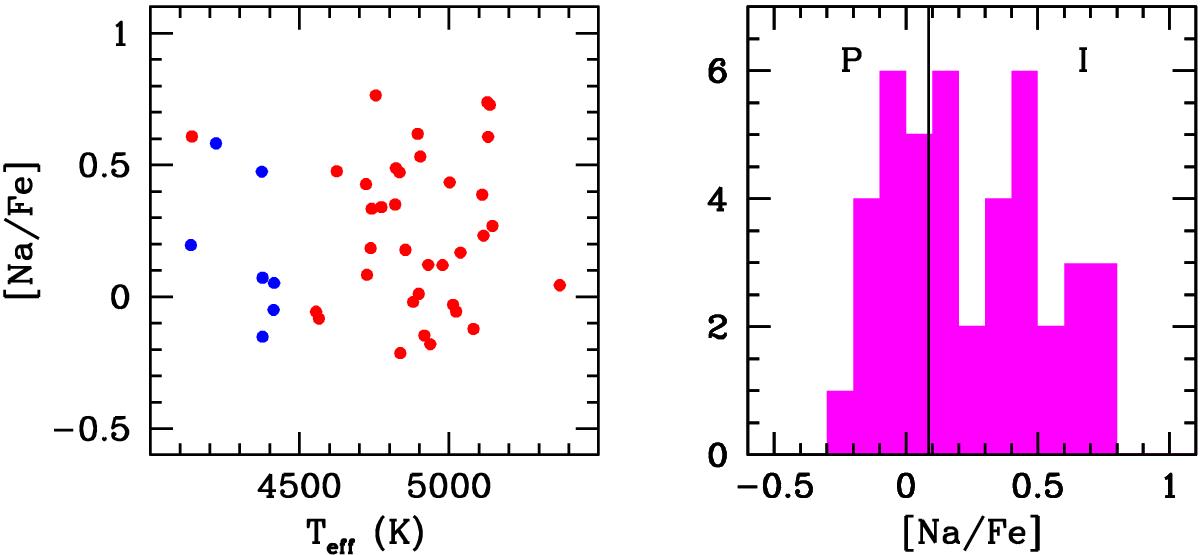
Left-hand panel: [Na/Fe] ratios as a function of the temperature in stars observed with UVES (blue squares) and GIRAFFE (red circles). Right-hand panel: histogram of the [Na/Fe] ratios, where the line indicates the division between P and I stars, based on our usual separation at [Na/Fe]min + 0.3.
Current usage metrics show cumulative count of Article Views (full-text article views including HTML views, PDF and ePub downloads, according to the available data) and Abstracts Views on Vision4Press platform.
Data correspond to usage on the plateform after 2015. The current usage metrics is available 48-96 hours after online publication and is updated daily on week days.
Initial download of the metrics may take a while.