Fig. 3
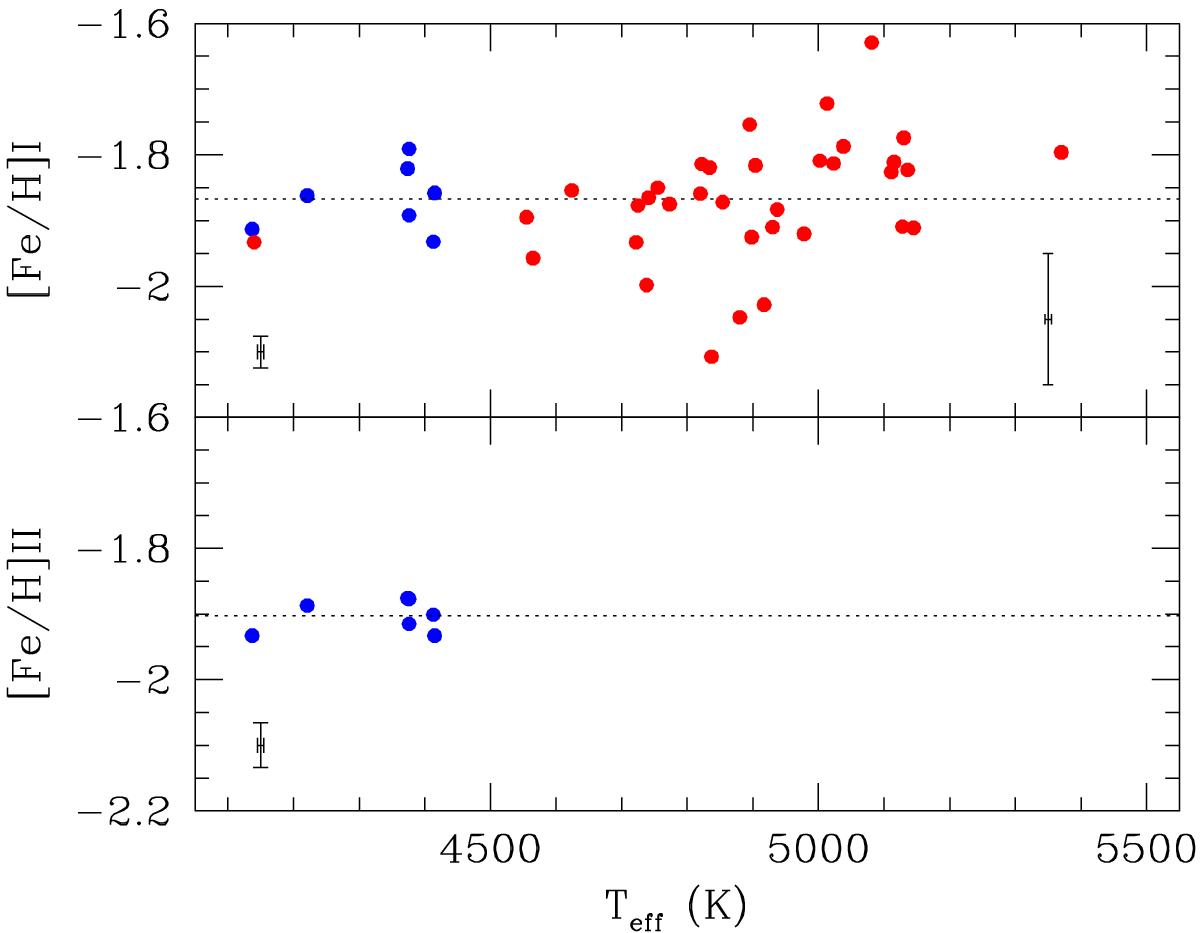
Run of the iron abundances as a function of the effective temperature for the seven UVES stars (blue circles) and stars with GIRAFFE spectra (red circles). Abundances from singly ionised Fe lines are shown in the lower panel for UVES stars only. Internal error bars are also displayed (for the UVES sample on the left corner, for the GIRAFFE sample in the right corner). The dotted line is the average abundance derived from the UVES spectra.
Current usage metrics show cumulative count of Article Views (full-text article views including HTML views, PDF and ePub downloads, according to the available data) and Abstracts Views on Vision4Press platform.
Data correspond to usage on the plateform after 2015. The current usage metrics is available 48-96 hours after online publication and is updated daily on week days.
Initial download of the metrics may take a while.