Fig. 2
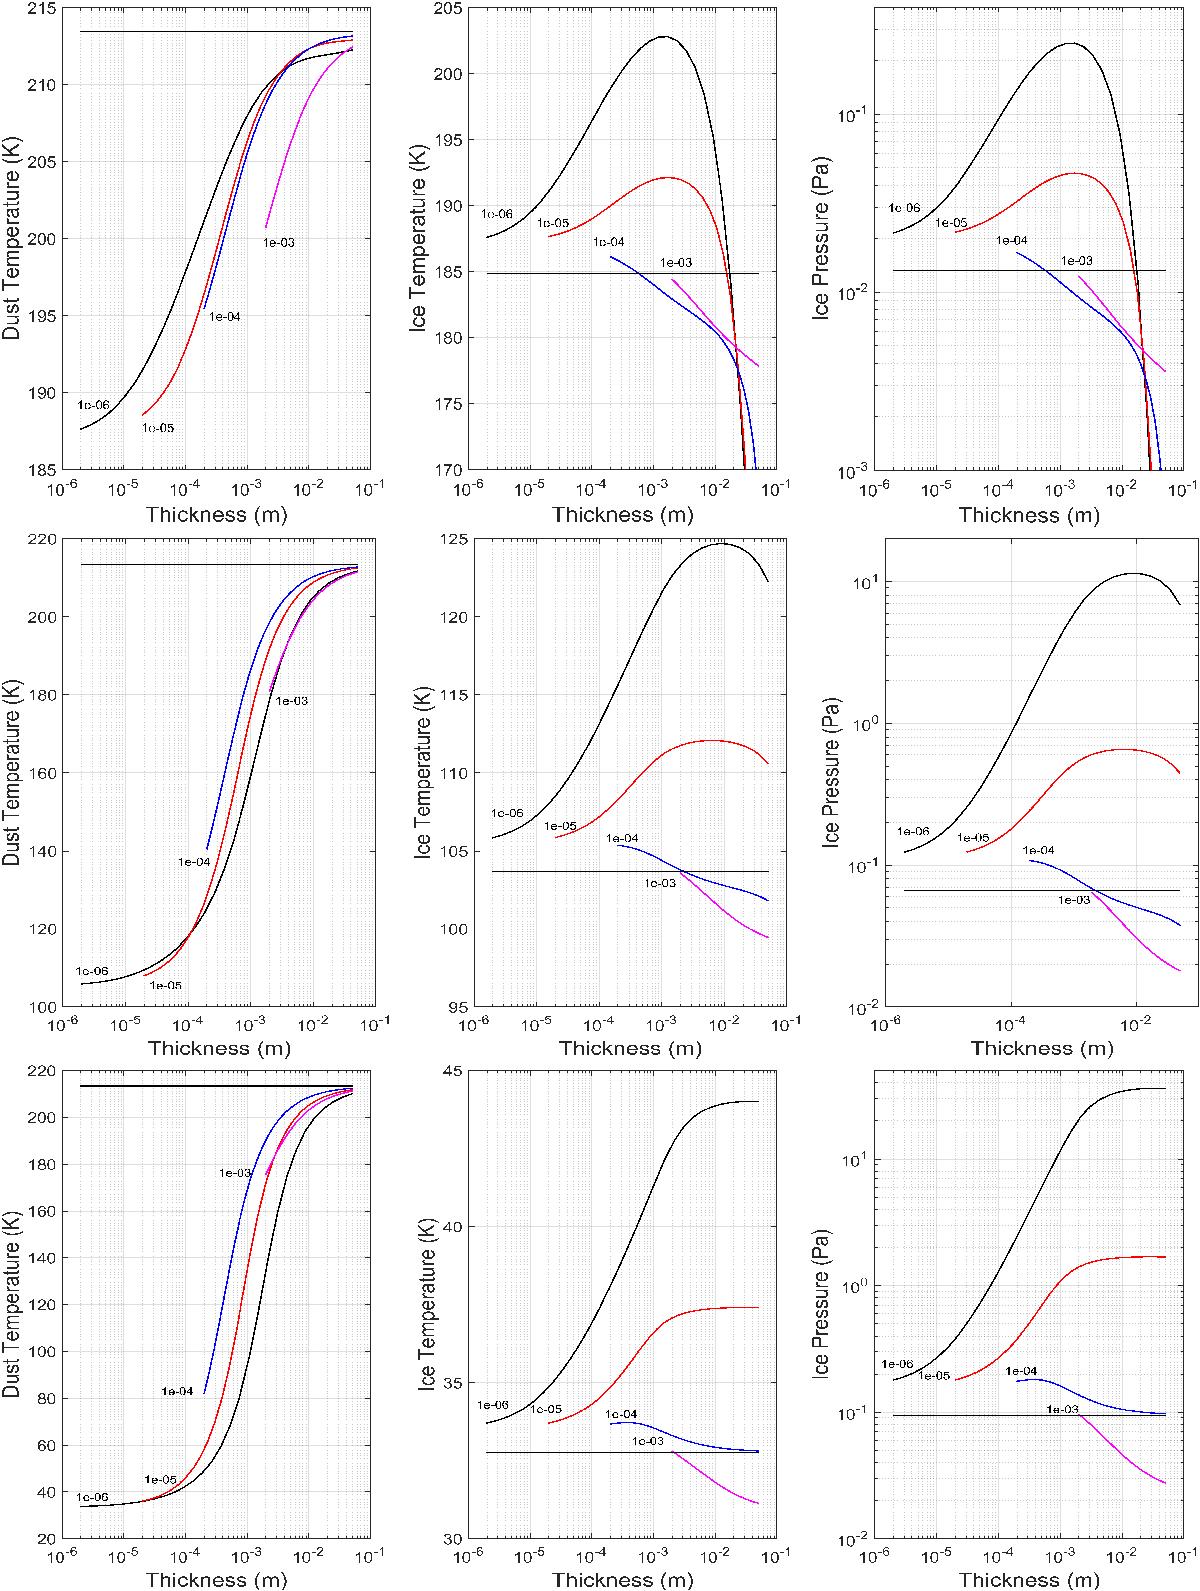
Surface temperature (left column), the interface temperature (middle column), and the vapor pressure (right column) as a function of the layer thickness at the heliocentric distance RH = 3.4 AU. Results are plotted for water (top row), carbon dioxide (middle row), and carbon monoxide (bottom row) ices. Aggregate radii are shown on the curves. The horizontal lines indicate the blackbody temperature (left column), the bare ice temperature (middle), and the corresponding saturation pressure (right).
Current usage metrics show cumulative count of Article Views (full-text article views including HTML views, PDF and ePub downloads, according to the available data) and Abstracts Views on Vision4Press platform.
Data correspond to usage on the plateform after 2015. The current usage metrics is available 48-96 hours after online publication and is updated daily on week days.
Initial download of the metrics may take a while.