Fig. 2
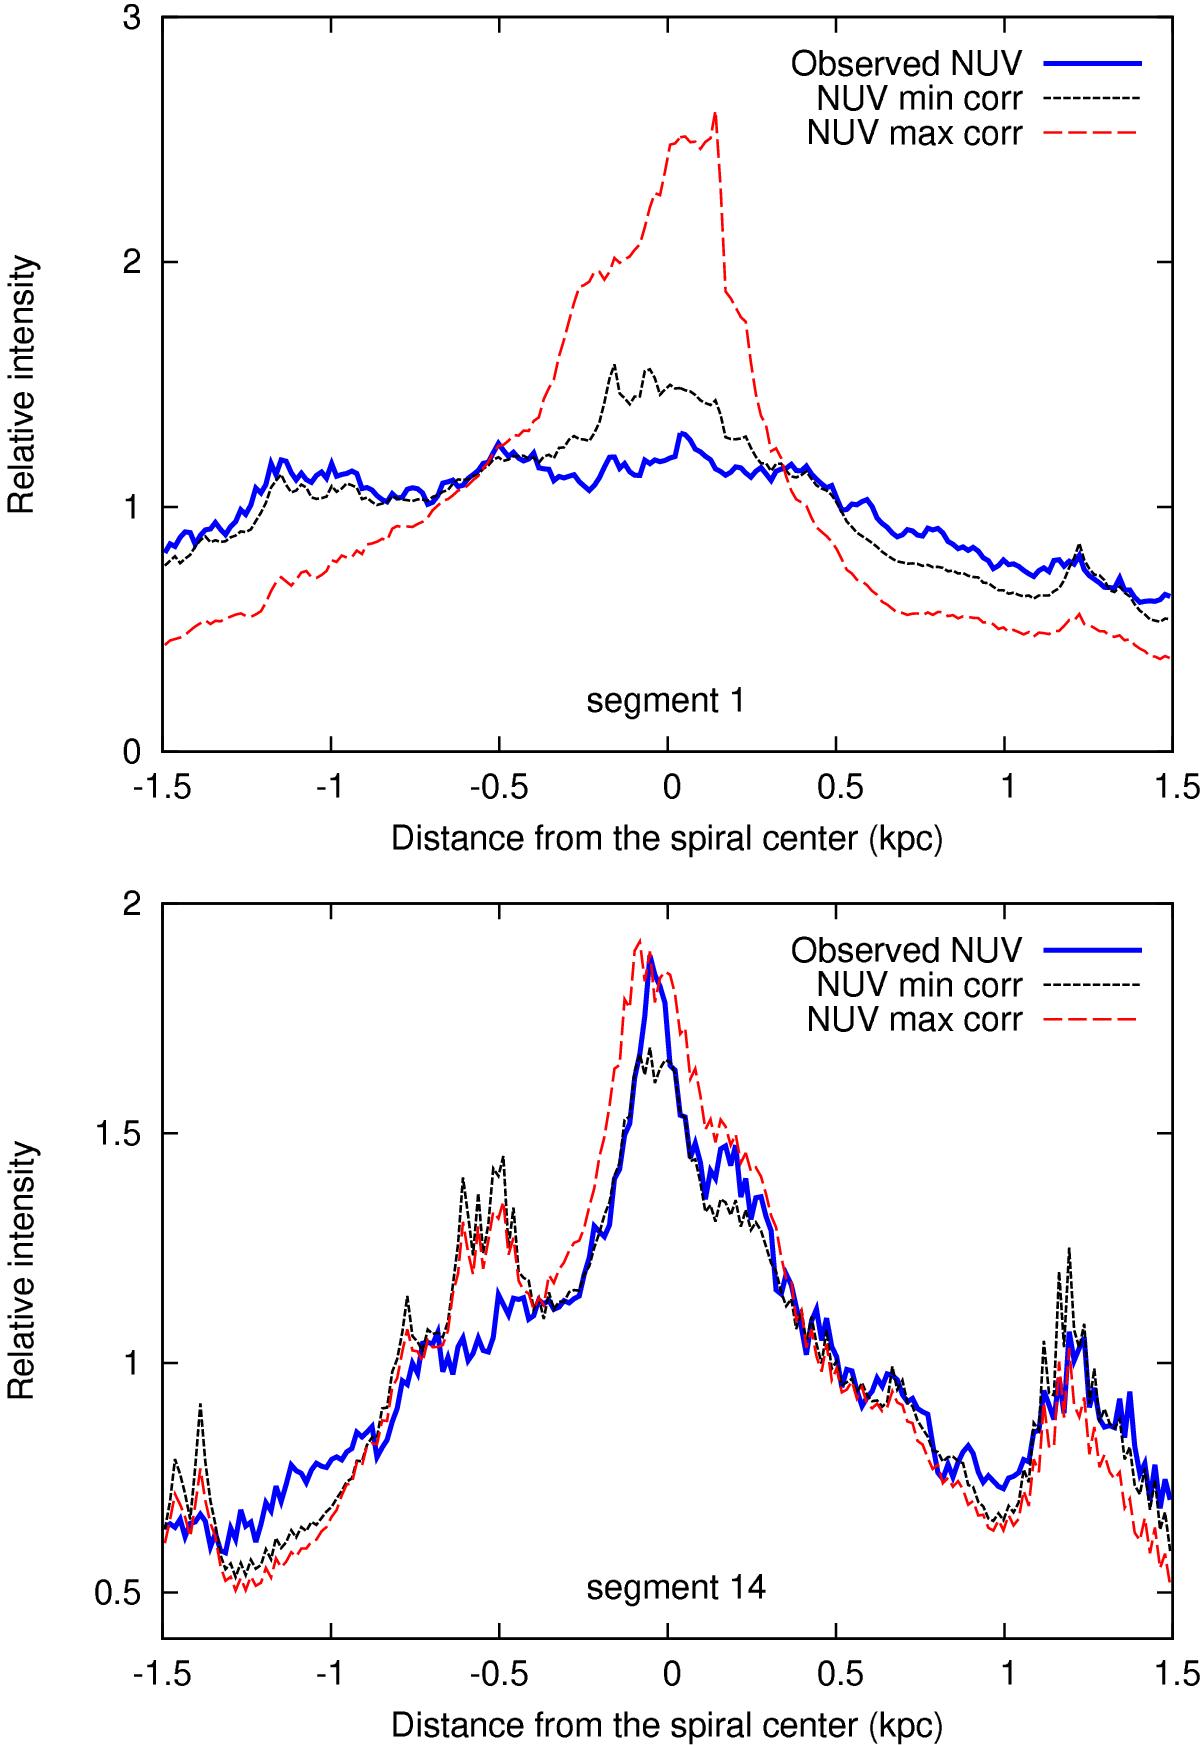
NUV emission distribution along the cross sections of spiral arm segments 1 (upper panel) and 14 (lower panel). The blue line denotes emission derived from the original NUV map. Red and black lines denote the upper and lower estimates for the extinction-corrected distribution, respectively; the true extinction-corrected NUV emission distribution lies somewhere in between. The vertical scale is relative.
Current usage metrics show cumulative count of Article Views (full-text article views including HTML views, PDF and ePub downloads, according to the available data) and Abstracts Views on Vision4Press platform.
Data correspond to usage on the plateform after 2015. The current usage metrics is available 48-96 hours after online publication and is updated daily on week days.
Initial download of the metrics may take a while.