Fig. 6
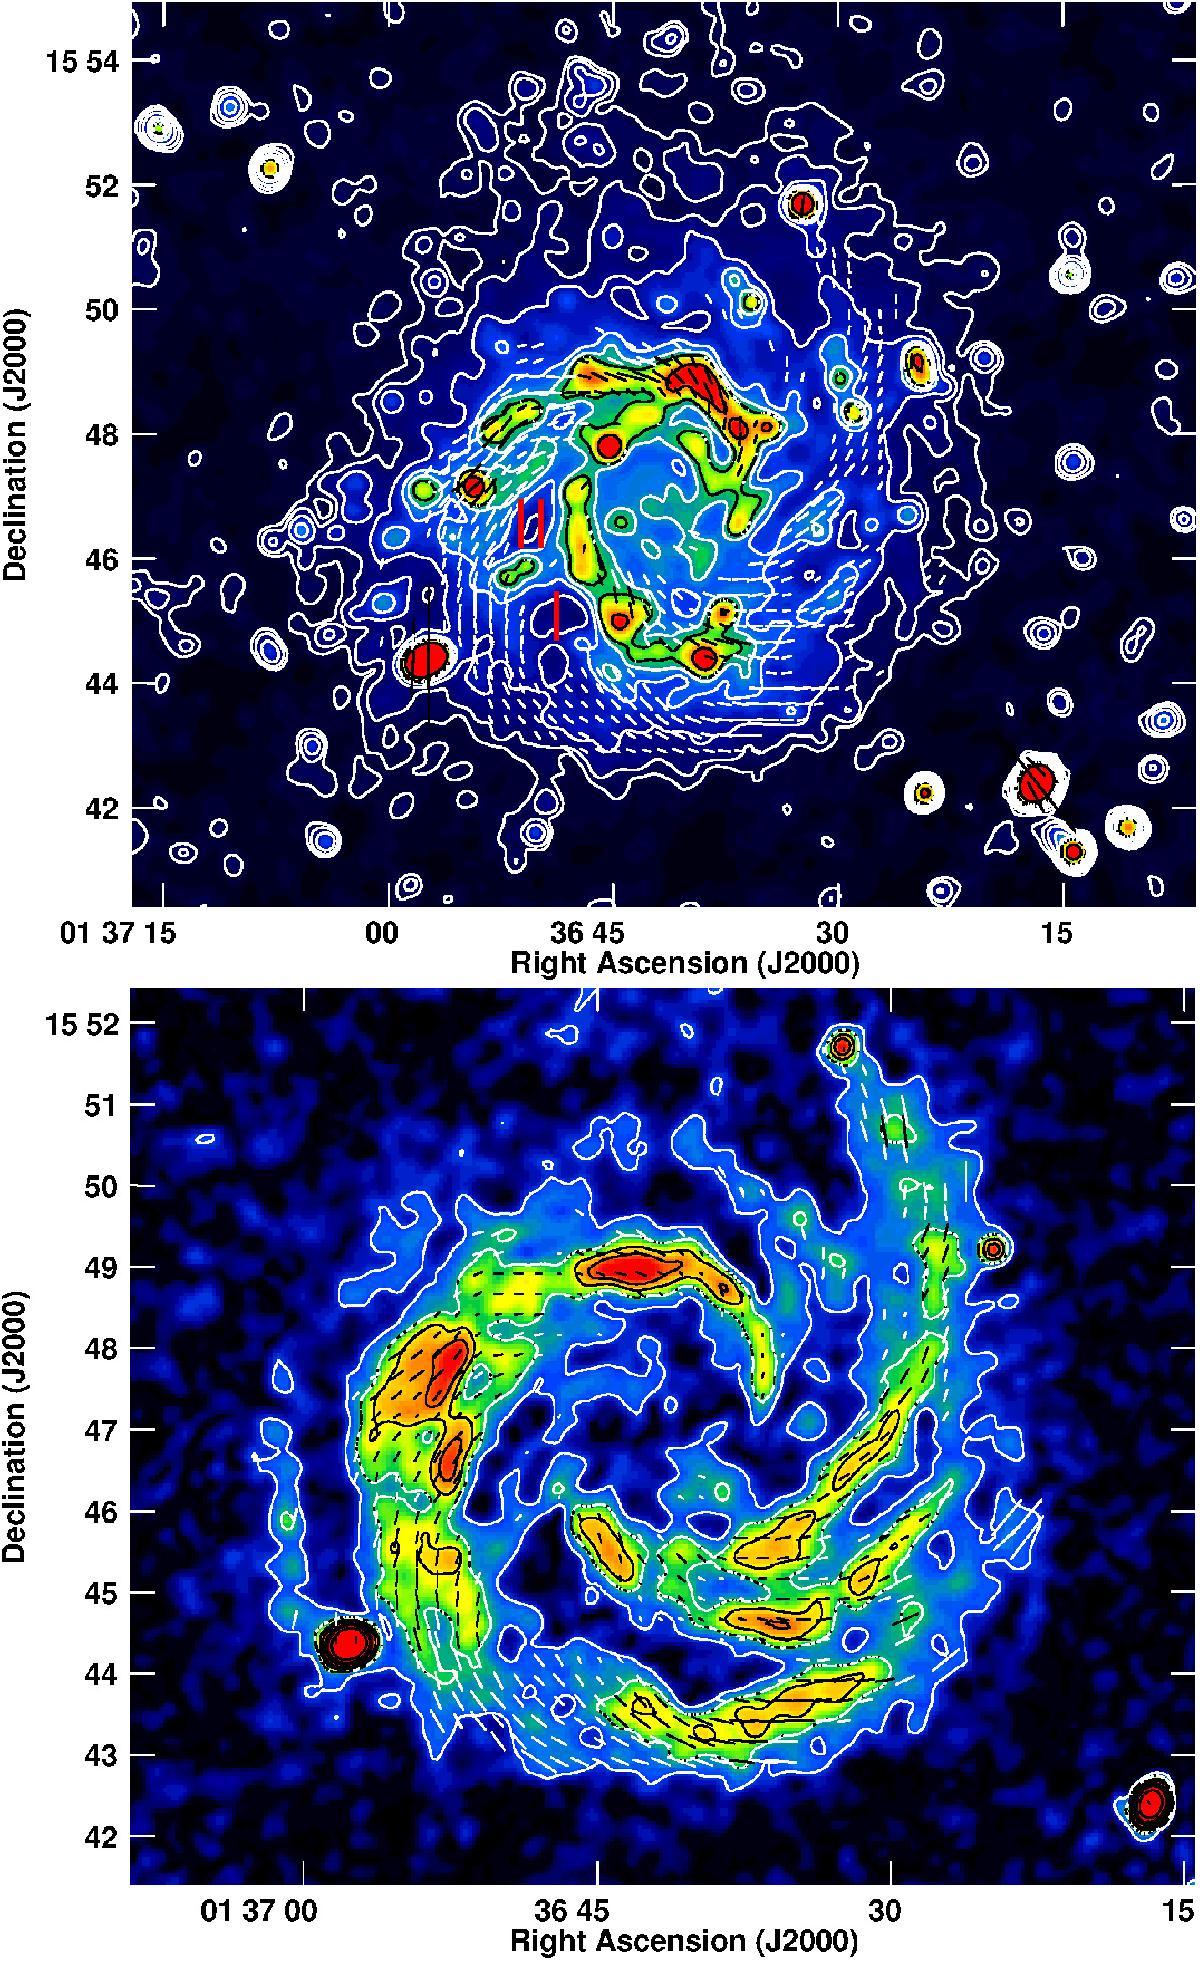
Natural-weighted JVLA image of NGC 628 of total intensity (top) and linearly polarised intensity (bottom) at 3.1 GHz at a resolution of 18″, averaged over all channels. Contours of total intensity are at 1, 2, 4, 8, 12, 16, 32 × 20 μJy/beam. Contours of polarised intensity are at 1, 2, 3, 4, 8, 12 × 15 μJy/beam. The lines show the magnetic field vectors (E + 90°), not corrected for Faraday rotation, with a length of 10″ representing a polarised intensity of 150 μJy/beam (top) and 30% degree of polarisation (bottom), respectively. The roman numerals I and II refer to the H I holes shown in Fig. 7.
Current usage metrics show cumulative count of Article Views (full-text article views including HTML views, PDF and ePub downloads, according to the available data) and Abstracts Views on Vision4Press platform.
Data correspond to usage on the plateform after 2015. The current usage metrics is available 48-96 hours after online publication and is updated daily on week days.
Initial download of the metrics may take a while.