Fig. 5
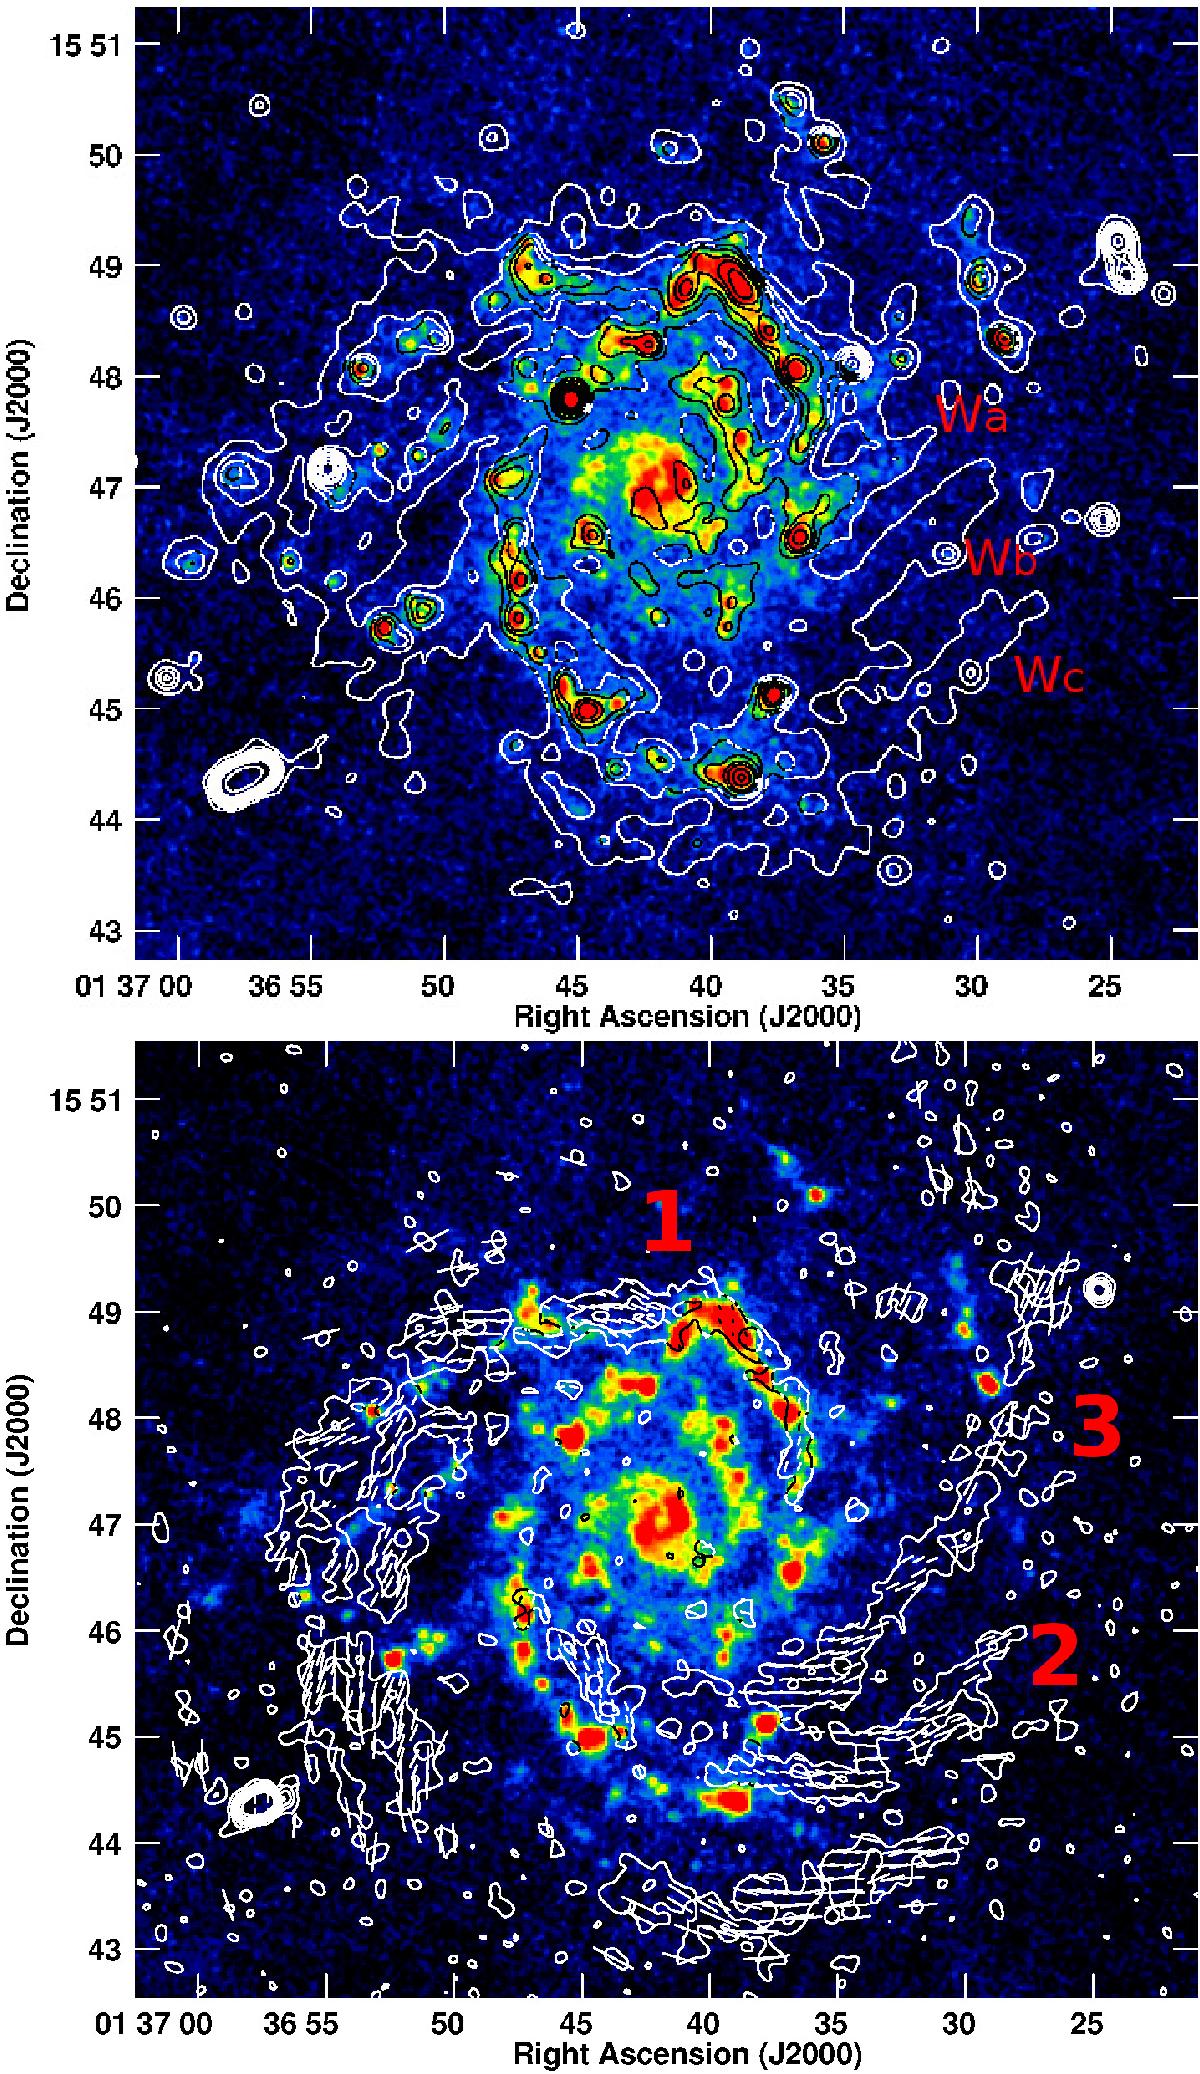
Robust-weighted JVLA image of NGC 628 of total intensity (top) and linearly polarised intensity (bottom) at 3.1 GHz at a resolution of 10″, averaged over all channels, and overlaid onto an 70 μm IR image from Herschel (Kennicutt et al. 2011). Contours of total intensity are at 1, 2, 3, 4, 6, 8, 12, 16, 32, 64, 128 × 40 μJy/beam. The nonthermal arms to the west are marked Wa to Wc for future reference. Contours of polarised intensity are at 1, 2, 3, 4, 6, 8, 12 × 12 μJy/beam. The white lines show the magnetic field orientations (E + 90°), not corrected for Faraday rotation, with a length of 10″ representing 30% degree of polarisation. The main polarised arms are marked from 1 to 3 for future reference.
Current usage metrics show cumulative count of Article Views (full-text article views including HTML views, PDF and ePub downloads, according to the available data) and Abstracts Views on Vision4Press platform.
Data correspond to usage on the plateform after 2015. The current usage metrics is available 48-96 hours after online publication and is updated daily on week days.
Initial download of the metrics may take a while.