Free Access
Fig. 18
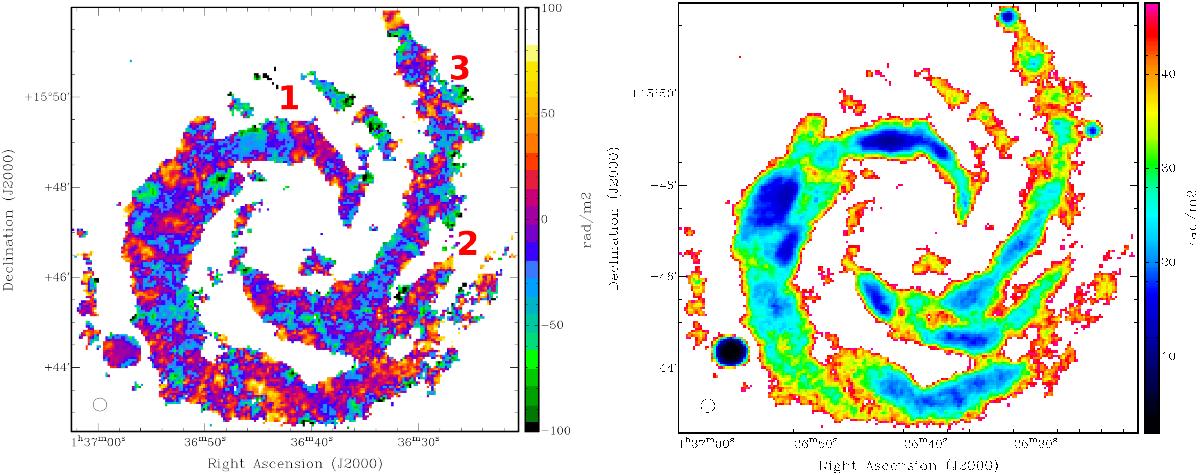
Maps of the maximum fitted Faraday depth φmax (left) and the corresponding Faraday depth error σφ (right) at a resolution of 18″ marked by an ellipse in the bottom left. Both quantities are measured in units of rad m-2. The polarised arms defined in Fig. 5 are shown here marked in red.
This figure is made of several images, please see below:


Current usage metrics show cumulative count of Article Views (full-text article views including HTML views, PDF and ePub downloads, according to the available data) and Abstracts Views on Vision4Press platform.
Data correspond to usage on the plateform after 2015. The current usage metrics is available 48-96 hours after online publication and is updated daily on week days.
Initial download of the metrics may take a while.