Fig. 13
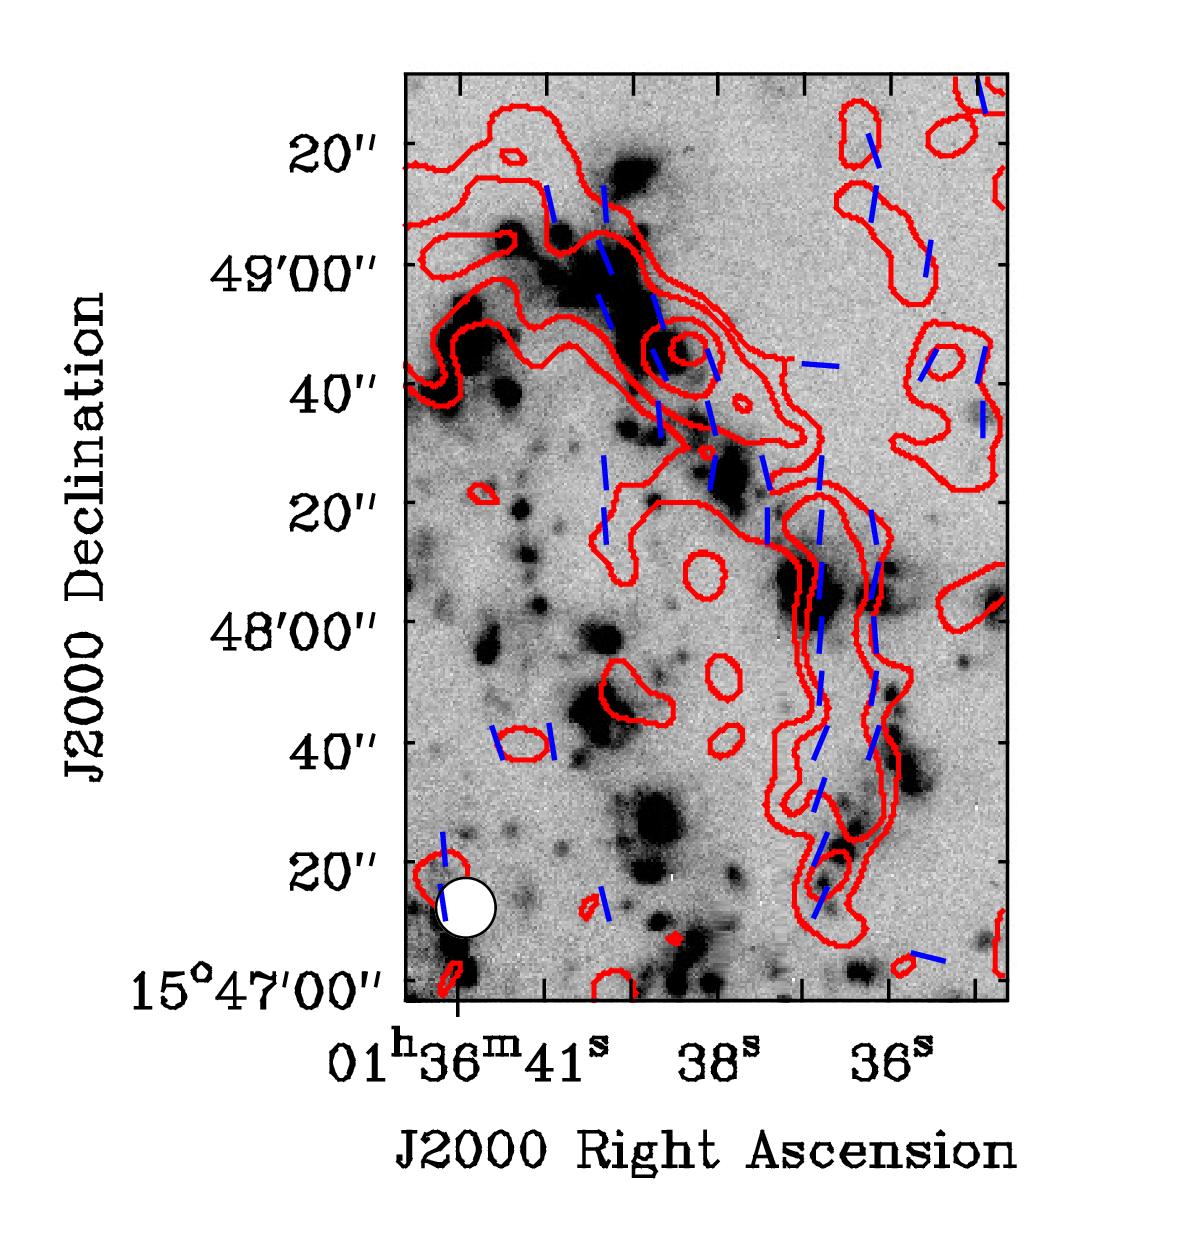
Polarised emission following the largest H II complexes in the galaxy. Polarised intensity and magnetic vectors are overlaid onto an Hα image (Dale et al. 2009). Contours of polarised intensity are at 9, 15, 24, and 30 μJy/beam. The resolution of the JVLA image at 10″ is illustrated by the ellipse located in the bottom left corner.
Current usage metrics show cumulative count of Article Views (full-text article views including HTML views, PDF and ePub downloads, according to the available data) and Abstracts Views on Vision4Press platform.
Data correspond to usage on the plateform after 2015. The current usage metrics is available 48-96 hours after online publication and is updated daily on week days.
Initial download of the metrics may take a while.